• Home
  • Blog
  • GMSC
    • Our Mission
    • Meet the Team
    • Careers
  • Bookstore
  • Contact
  • Search
  • Try MetaPulse →
Menu

MetaPulse Blog

101 California Street, Suite 2710
San Francisco, CA, 94111
+1 (415) 881-7952
Know how to grow with the world's first Growth Management System.™

Your Custom Text Here

MetaPulse Blog

  • Home
  • Blog
  • GMSC
  • About
    • Our Mission
    • Meet the Team
    • Careers
  • Bookstore
  • Contact
  • Search
  • Try MetaPulse →

MetaPulse現已推出中文版!(MetaPulse is now available in Chinese!)

December 9, 2021 MetaPulse Team

MetaPulse is expanding, not just with awesome new features, but with our language capabilities too!

In addition to French and Russian, we’ve just launched Traditional Chinese!

That opens up the app to an additional 1.4 billion people 😎.

See How to Change Your Language Settings for more information.

We’ve also been working hard translating our help documentation into Chinese too. 

So to all our Chinese speaking friends, 歡迎來到 MetaPulse (Welcome to MetaPulse).

And if you want MetaPulse translated into your language and are interested in becoming one of our language partners, please let us know!

Please reach out to us if you need help, we offer full onboarding for your entire team.


oOo

Know how to grow with MetaPulse! The world’s first Growth Management System™ Application with Knowledge, Org Charts, Statistics, Objectives, Trends, Events and Reports. Try for free on a no-risk 14-day trial. We’ll even help you set up all your existing statistics to make sure you succeed in getting your business onto MetaPulse. 

Comment and ask questions below or ask questions privately.

In New Features Tags stats, analytics, OKRs, Org Chart, Knowledge
Comment

VIDEO: Adding and Removing Graphs from the Dashboard

January 19, 2021 MetaPulse Team

Here is our next tutorial video on helping you learn and use envisage.

Here we introduce the Dashboard and how to add and remove graphs.

You can also search the Help Center for more videos.

Enjoy!

In Tutorials Tags stats, analytics, video
Comment

5000 and counting

October 22, 2020 MetaPulse Team
thank you - 5000 users.png

We’re truly thrilled to announce that we recently surpassed over 5000 users!

We’d like to take this opportunity to thank you all for your loyalty and trust.

We plan to end this year with a bang by releasing some amazing new features. We will tell you more soon!

In the meantime, remember we offer full onboarding for your entire team, so if you need help, let us know.

oOo

Know how to grow with envisage! The world’s first Growth Management System™ Application with Statistics, Org Charts, Objectives, Trends, Events and Reports. Try for free on a no-risk 14-day trial. We’ll even help you set up all your existing statistics to make sure you succeed in getting your business onto Envisage. 

Comment and ask questions below or ask questions privately.

In Case Study Tags stats, OKRs, analytics, Org Chart
Comment

The New Trends Feature with Machine Learning

June 16, 2020 MetaPulse Team
trend feature.png

As your organization expands, monitoring every vital statistic can become cumbersome. As the number of graphs grow into the thousands, how do you keep track of everything?

We’ve solved that problem with Trends!

For almost a year we’ve been building and testing our new Trend feature. It’s a game changer for big companies who want a fast way to identify what is failing and what is working.

Here’s how it works:

Read more
In New Features Tags stats, OKRs, Analytics, Org Chart, Trends, Artificial Intelligence
Comment

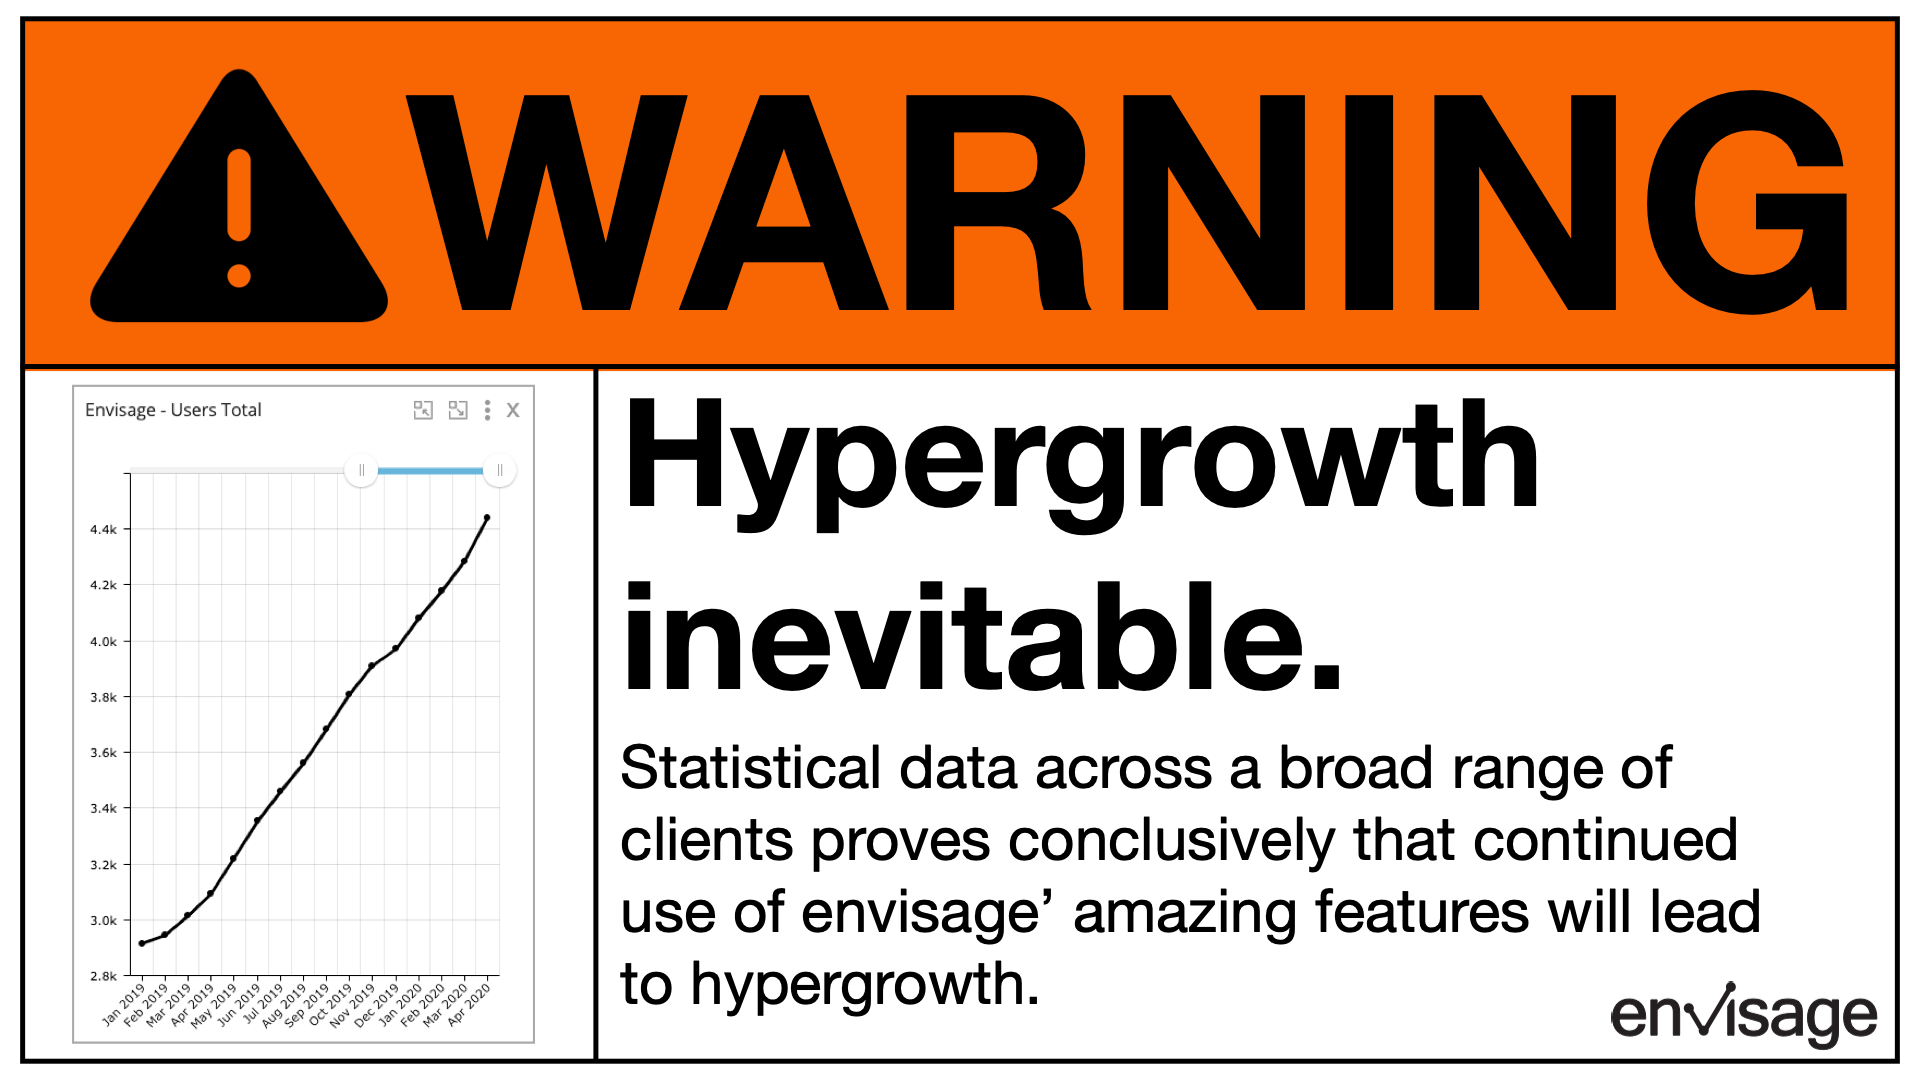
Warning - Hypergrowth Inevitable

May 26, 2020 MetaPulse Team
warning - hypergrowth.png

Before you jump in and start using envisage, we thought we should provide full disclosure. 

Envisage not only enables hypergrowth, it makes it inevitable. 

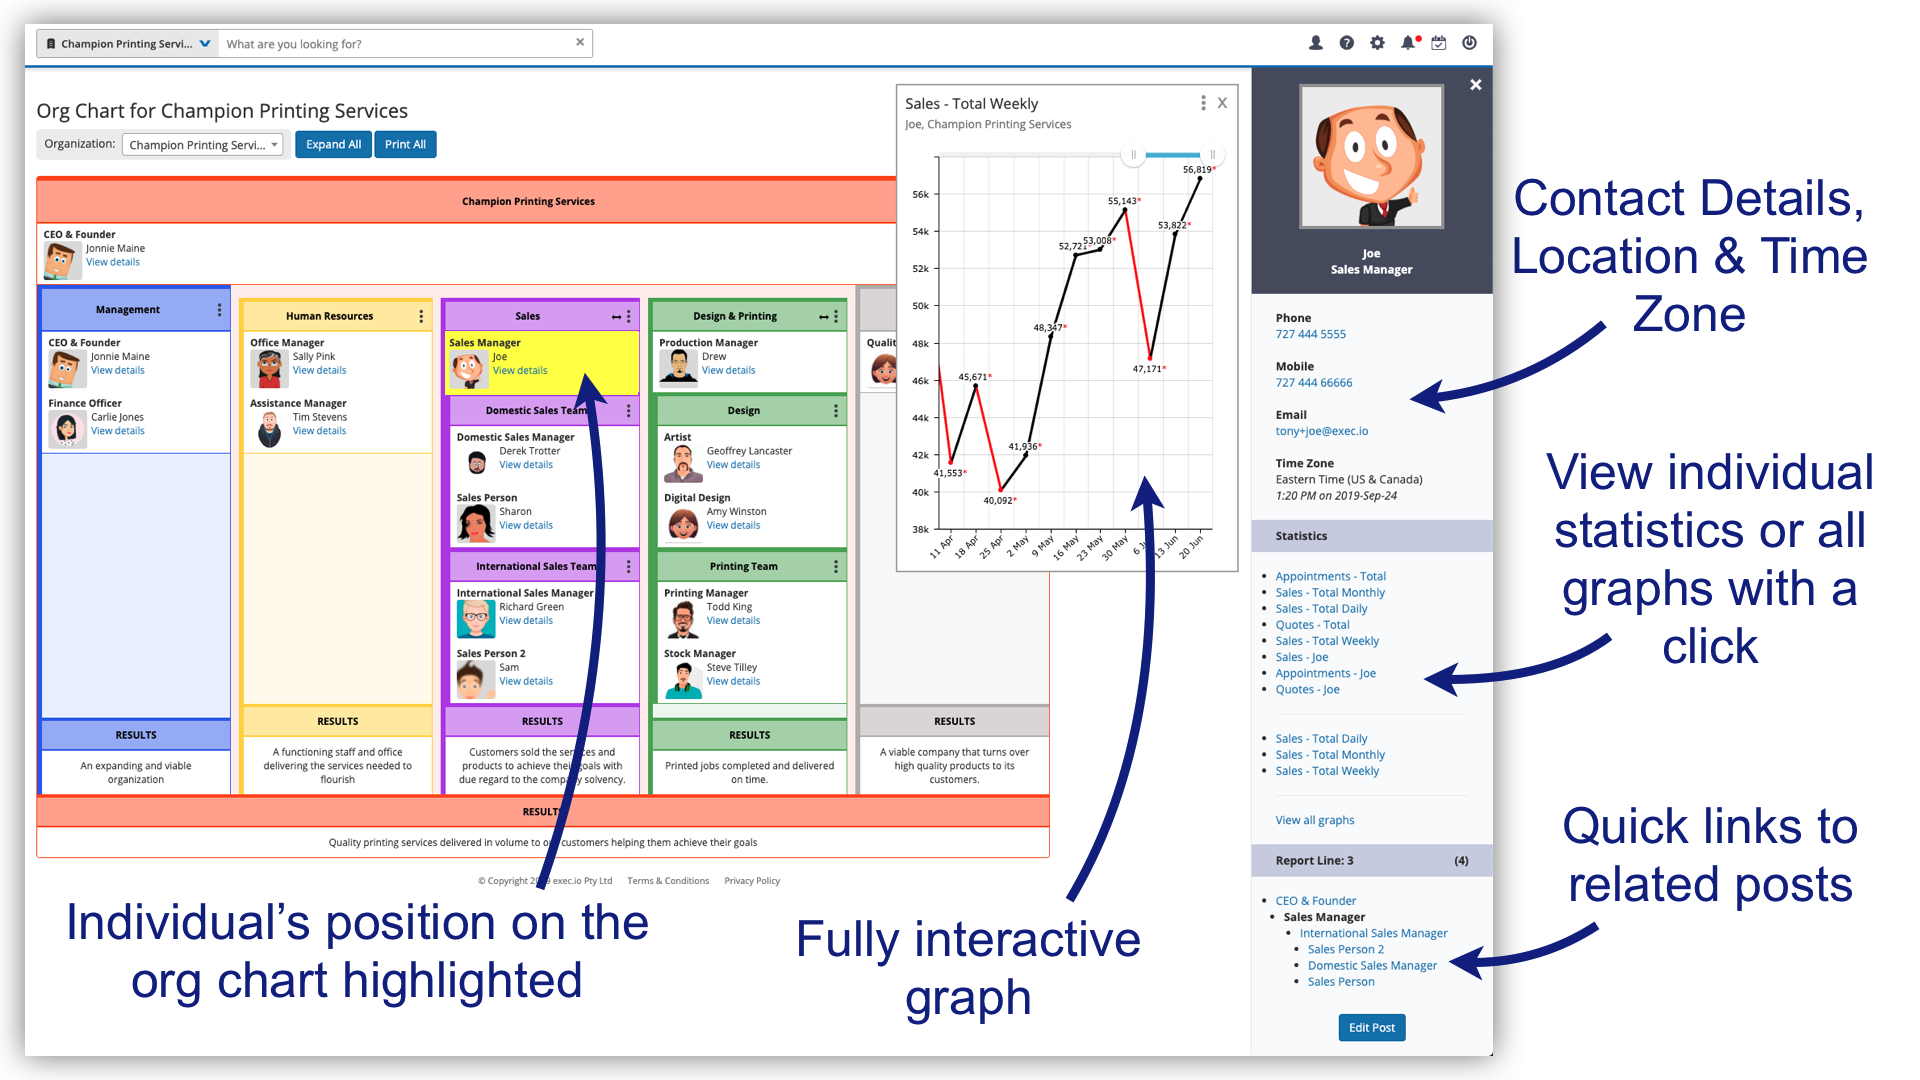
When you combine the power of the org chart, statistics and objectives together across your organization, the only way to go is up. 

This isn’t theory. It’s based on stats.

As our user base grows, despite worldwide turmoil, so do many of our clients. 

They’re not just surviving, they're thriving!

To build an organization, you need to organize and align your forces. Envisage lets you see what happened, when it happened, who did it and most of all, enables you to plan what will happen. 

Are you ready for hypergrowth?  It starts with your org chart and for the month of May we’re offering to build it in envisage for you, free of charge. 

This service is valued at $199. For more information register here.

And remember, envisage includes Statistics, Org Chart and OKRs and you can try free on a no risk 14-day trial. We’ll even help you set up all your existing statistics to make sure you succeed in getting your business onto Envisage. 

Comment and ask questions below or ask questions privately.

In Case Study, Best Practice, Business Coaching, Book Reviews, New Features, Technology Tags stats, OKRs, analytics, Org Chart
Comment

Managing Remote Staff with Envisage

April 7, 2020 MetaPulse Team
remote office-2.png

Is your team working from home?

How do you know if the job is still getting done?

How can you see their production?

It’s easy with envisage. Here’s how you do it:

  1. Give everyone on your team at least one statistic that tracks their results - e.g. number of tasks completed, phone calls made, emails answered.

  2. Get everyone to enter their statistic daily, at the end of the working day or first thing the next day.

org chart search results.png

The benefits:

  1. As the manager or owner, you’ll be able to see how your team is doing.

  2. Everyone will still feel part of a productive team getting things done.

  3. You’ll be able to spot lagging statistics early and help that person or area get their production into the desired range.

We have clients with over 800 staff who have shifted to remote work and because they use envisage, they are able to operate just like they were in the office. Why not give it a try?

And remember envisage includes Statistics, Org Chart and OKRs and you can try for free on a no-risk 14-day trial. We’ll even help you set up all your existing statistics to make sure you succeed in getting your business onto Envisage. 

Comment and ask questions below or ask questions privately.

In Best Practice Tags stats
Comment

Data Entry Now Has Autosave

March 2, 2020 MetaPulse Team

We’ve made Data Entry even easier with Autosave.

All you have to do is enter the value. As soon as you hit Enter or Tab to the next row, envisage will automatically save your data.

Read more
In New Features Tags stats
Comment

Still using spreadsheets to track your stats? Save time with MetaPulse.

January 30, 2020 MetaPulse Team

Clients never cease to be amazed at the amount of time they can save when taking advantage of the features in MetaPulse age. 

Here’s some common scenarios we’ve come across: (And if any of these apply to you, we can save you a lot of time.)

  1. It takes you more than 1 hour per week to work out the stats and enter them into your existing system.

  2. You add stats daily to a spreadsheet and then tally them for your weekly or monthly stats.

  3. You manually add up different stats using a calculator.

  4. Your stats are spread across several different spreadsheets.

  5. You track the stats by paper and spend hours entering them into a system.

  6. You have to constantly chase your team to report their stats to you.

If you’re suffering from any of the above, we can help streamline your stats reporting process. We’ve helped many clients save countless hours collating a myriad of numbers.

Entering statistics should be a simple and easy task. More time should be spent on analyzing and implementing solutions to improve those statistics.

Need help? Reach out via support  or just reply to this email and we’ll help you get set up. 

Remember you can try MetaPulse for free on a no-risk 14-day trial—it includes stats, org chart and objectives. We’ll even help you set up all your existing statistics to make sure you succeed in getting your business onto MetaPulse. 

Comment and ask questions below or ask questions privately.

In Best Practice Tags stats, analytics
Comment

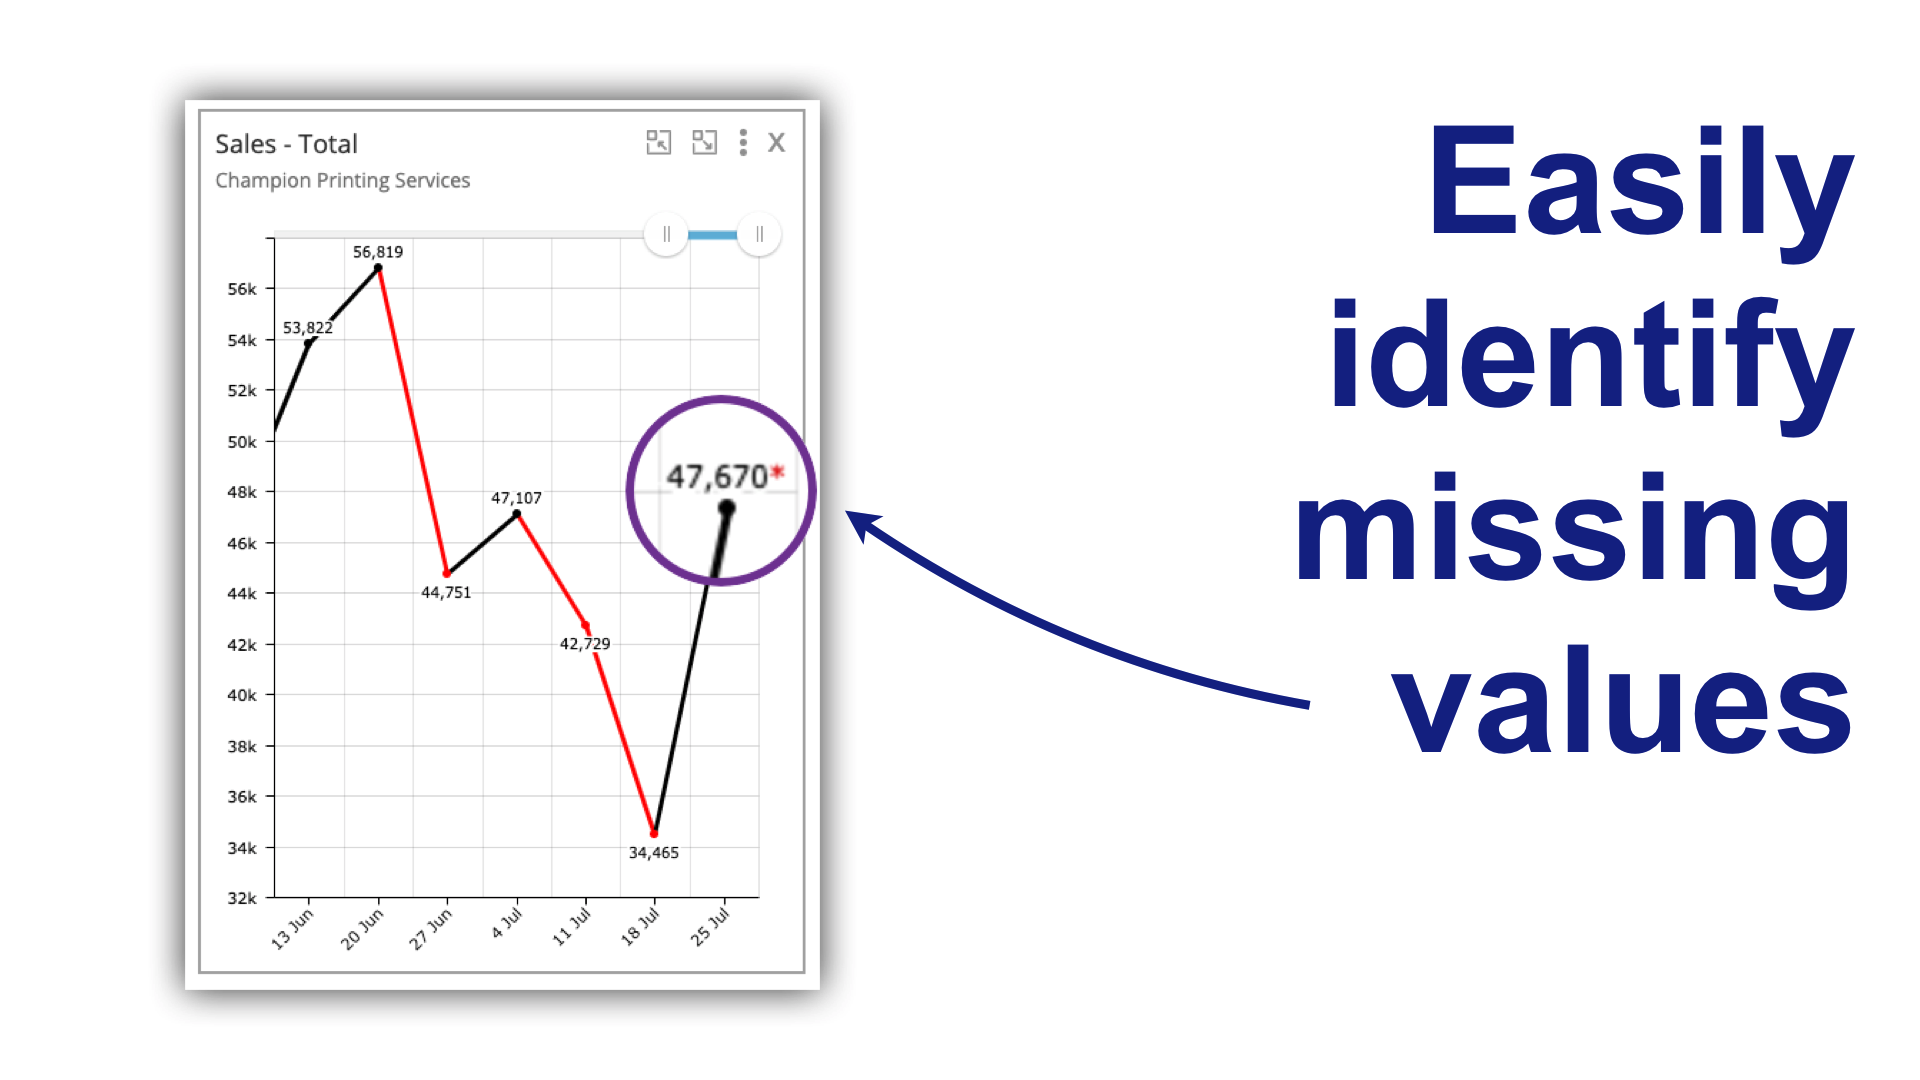
Easily identify missing values and no reports

July 30, 2019 MetaPulse Team
easily identify missing values.png

Back in June we released a powerful new report feature that ensures everyone on your team is playing to win.

We’ve now enhanced this feature so you can easily see missing values or no reports.

Read more
In Best Practice Tags OKR, analytics, stats, Sales
Comment

When Average is better - An Introduction to the Status Statistic

July 22, 2019 MetaPulse Team
show average weekly monthly quaterly.png

Many businesses track statistics such as sales, income and leads. These are cumulative statistics where weekly values add up to monthly values. For example, 10 sales a week totals 40 per month (and with our new split values feature, you can be certain that envisage is reporting an accurately adjusted monthly value).

But what about a statistic like Bank Balance? This is not the type of statistic you want to “add up” when changing the frequency from days or weeks to months.

Read more
In Best Practice Tags stats, analytics, OKR
Comment

The problem of time solved - Great Scott!

July 12, 2019 MetaPulse Team
time problem.png

Time is a problem. You think there are 365 days in a year?

Nope, there’s 365.2422. This is a rather inconvenient number so it’s rounded up to 365.25 and we have a leap year every 4 years to account for that annoying extra quarter day each year.

No big deal? But consider this … A vital element of monitoring statistics in your business accuracy and precision.

You want to ensure that if you earned $9,876 in a week, that this is the precise, exact amount, it doesn't get rounded up or down. It's exact and precise.

Unfortunately statistics are measured against time and time is not very precise.

But what if you wanted an accurate MONTHLY value at the same time as having an accurate WEEKLY value? Well, we've solve it!

Read more
In Best Practice Tags stats, OKR, analytics
Comment

Save Paper - Use Share Links

July 4, 2019 MetaPulse Team

Go Paperless

Save time, money and the environment

If you’re endeavoring to create a “paperless office environment” then this article is for you.

Envisage makes it easy to share your graphs, without having to print.

This is especially useful for those with staff who work remotely, or for managers and owners who travel.

During our weekly meeting at exec.io we have people spread around the global, in Perth, Western Australia; Sydney on the east coast of Australia; and yours truly in Florida, USA.

So printing graphs for our team meeting is pointless.

Instead we use the share link. Here’s how we do it.

Read more
In Best Practice Tags OKR, stats, analytics, Management
Comment

We can upload all your statistics for free

June 28, 2019 MetaPulse Team
envisage free 14 days.png

If you use an excel spreadsheet or even an existing stats system, we make it easy for you to start using envisage.

All you need to do is send us your data and we will upload it free of charge.

And for the first 14 days, you get to try envisage for free.

Pretty good deal, don’t you think?

Give envisage a try today.

If you have an existing app you use, we can help you export your data and import it into envisage, just reach out to us.

And for more information on uploading your historical data go here.

Comment and asks questions below or ask questions privately.

And hit the heart if you like it.  

In Technology Tags stats, OKR, analytics
Comment

Why Do Apps Change and Why Are We Turning Off Our Most Popular Feature?

June 14, 2019 MetaPulse Team

Why the Change?

As of July 1, 2019 we’ll be turning off one of the most popular features in envisage. 

You may wonder, “Why would we do such a thing?”

This article will give you some background insight into what it takes to build a powerful online app used by thousands around the world.

Read more
In Technology Tags business analytics, stats, apps, OKR
Comment

How to Grow A Billion Dollar Business

May 31, 2019 MetaPulse Team
samuel-zeller-358865-unsplash.jpg

Let me give you some backstory. This event took place in late 1999, in Google’s office, before Google was the tech giant it is today.

And to clarify what I mean by “tech giant” let’s look at actual numbers. 

Google has an annual revenue of over $142 billion with a company valuation of $776 billion.

How did Google go from zero, to a $776 billion company in twenty years? 

Three letters: OKR and in started in 1999.

Read more
In Case Study Tags OKR, stats, Management
Comment

What is OKR?

May 25, 2019 MetaPulse Team
google OKR quote.png

What does Google, LinkedIn, Twitter and Uber have in common?

They used OKRs to manage and grow their business.

OKR stands for
Objectives and Key Results.

It’s a framework for defining and tracking objectives and their outcomes.

More simply put, it’s a way to ensure the right things get DONE!.

Read more
In Business Coaching Tags OKR, stats, Management
Comment

Client Question - How to Graph Monthly Income Weekly

May 23, 2019 MetaPulse Team

Weekly or Monthly?

That is the question!

This week we received this question via our Ask Us Anything

I have a client who does PPC marketing. He has all his clients pro-rated to the same day for his monthly service fee deducted from their card. It makes it difficult to graph Gross Income weekly other than monthly, without a crazy spike one week a month. Any suggestions?

Read more
In Business Coaching Tags stats, income, OKR
Comment

KISS: Up = Good, Down = Bad

April 16, 2019 MetaPulse Team

Up is Good


Down is Bad

My version of the KISS principle is Keep It Super Simple.

I’ve written books on many complex subjects such as taxes, money management, investing and marketing. I often get feedback on how easy my books are to read. I go to great lengths to keep things simple.

The opposite of a KISS is a KICK - Keeping It Complicated Knowingly. I much prefer a KISS to a KICK.💋

Read more
In Best Practice Tags stats, business analytics, Management, OKR
Comment

Introducing Results Driven Success

April 6, 2019 Mikel Lindsaar

Results Driven Success is the process of measuring the results of past actions to direct future actions to achieve greater success. It is used by companies around the world to improve their operations, identify areas that need attention, spot areas that are doing well to support them, and remove opinion and guess work from running an organization.

Read more
In Business Coaching Tags Sales, Human Resources, Management, Growth, analytics, stats, OKR

Welcome to the Envisage Blog

June 2, 2011 Mikel Lindsaar

Envisage is now up and running with hundreds of users signed up.  It's great to see our creation get started with lots of users and I thought for our first blog post I'd share some of our plans for the blog and what we want to build into the future.

Read more
In Technology Tags launch, stats, analytics
Comment
TRY envisage for 30 days
ASK US ANYTHING
 
MetaPulse RSS

chat with support.png
search the help center.png
schedule a free demo.png

Topics

Case studies
Best Practice
Business Coaching
Technology


Get free tips and insights once a week

We respect your privacy.

Thank you for joining and welcome to the team!


240px-Cc.logo.circle.svg.png
Cc-by_new.svg.png
 

© 2019 exec.io
except where otherwise noted content on this site is licensed under a Creative Commons Attribution-ShareAlike 4.0 International License.

PRIVACY POLICY | TERMS & conditions | COMMISSION DISCLOSURE