

My version of the KISS principle is Keep It Super Simple.
I’ve written books on many complex subjects such as taxes, money management, investing and marketing. I often get feedback on how easy my books are to read. I go to great lengths to keep things simple.
The opposite of a KISS is a KICK - Keeping It Complicated Knowingly. I much prefer a KISS to a KICK.💋
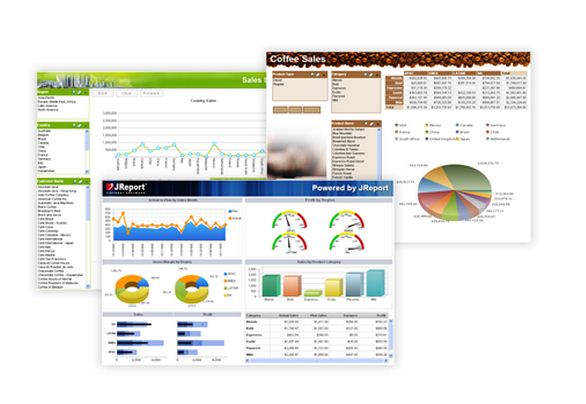
In business, when it comes to measuring performance and results, the KISS principle can be applied. Rather than using complex looking dashboards—with pie charts, Gantt charts, 3D charts, Maps, Scatterplots, Gauges and Tables—at envisage we use simple line graphs.
So instead of this…
You see this …

We take this even further with a simple principle.
Good = Up
Down = Bad
Here’s some things you will want to measure to instinctively know that Up = Good and Down = Bad.
Sales
Income
New Clients
Leads
Promotion Sent
But what about the following negative outcomes where Up = bad and Down = Good? Such things like:
Refunds
Client Complaints
Product Returns
Sick Days
You don’t want to glance over your dashboard and have to remember that “refunds” going down is a good thing. That is not following KISS.
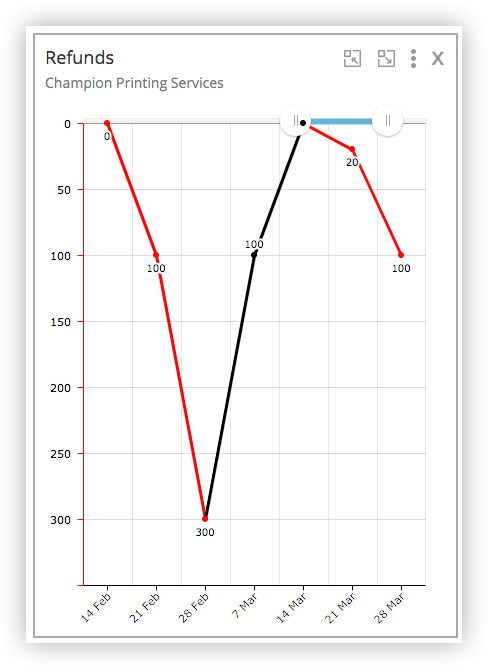
We have a simple solution. In envisage you can invert the graph so that Up = Good and Down = Bad. Ideally refunds are zero. So we put zero at the top. Like this …
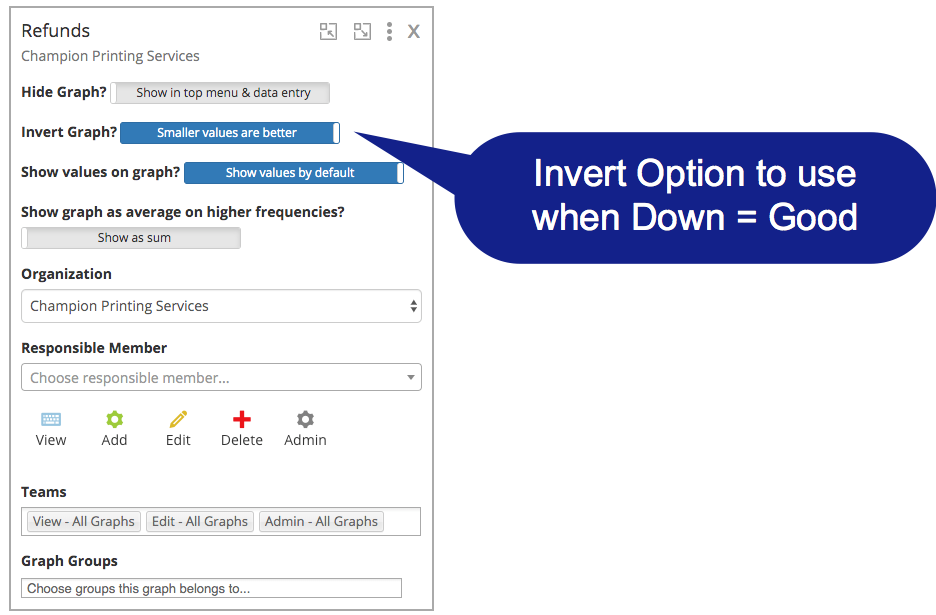
To do this, adjust the settings of the graph to “invert”, like so:
This keeps it simple. At a glance you can see if your business is getting better or worse. That is after all, the only reason to monitor your results. So the faster you can analyze your results, the faster you can take action.
Like I said, a KISS is always better than a KICK!
Agree?
Comment below or ask questions privately.
And hit the heart if you like it.