
Back in June, we released a powerful new reporting feature that helps ensure everyone on your team is playing to win (see that post here).
We’ve now enhanced this feature so you can easily see missing values or no reports.
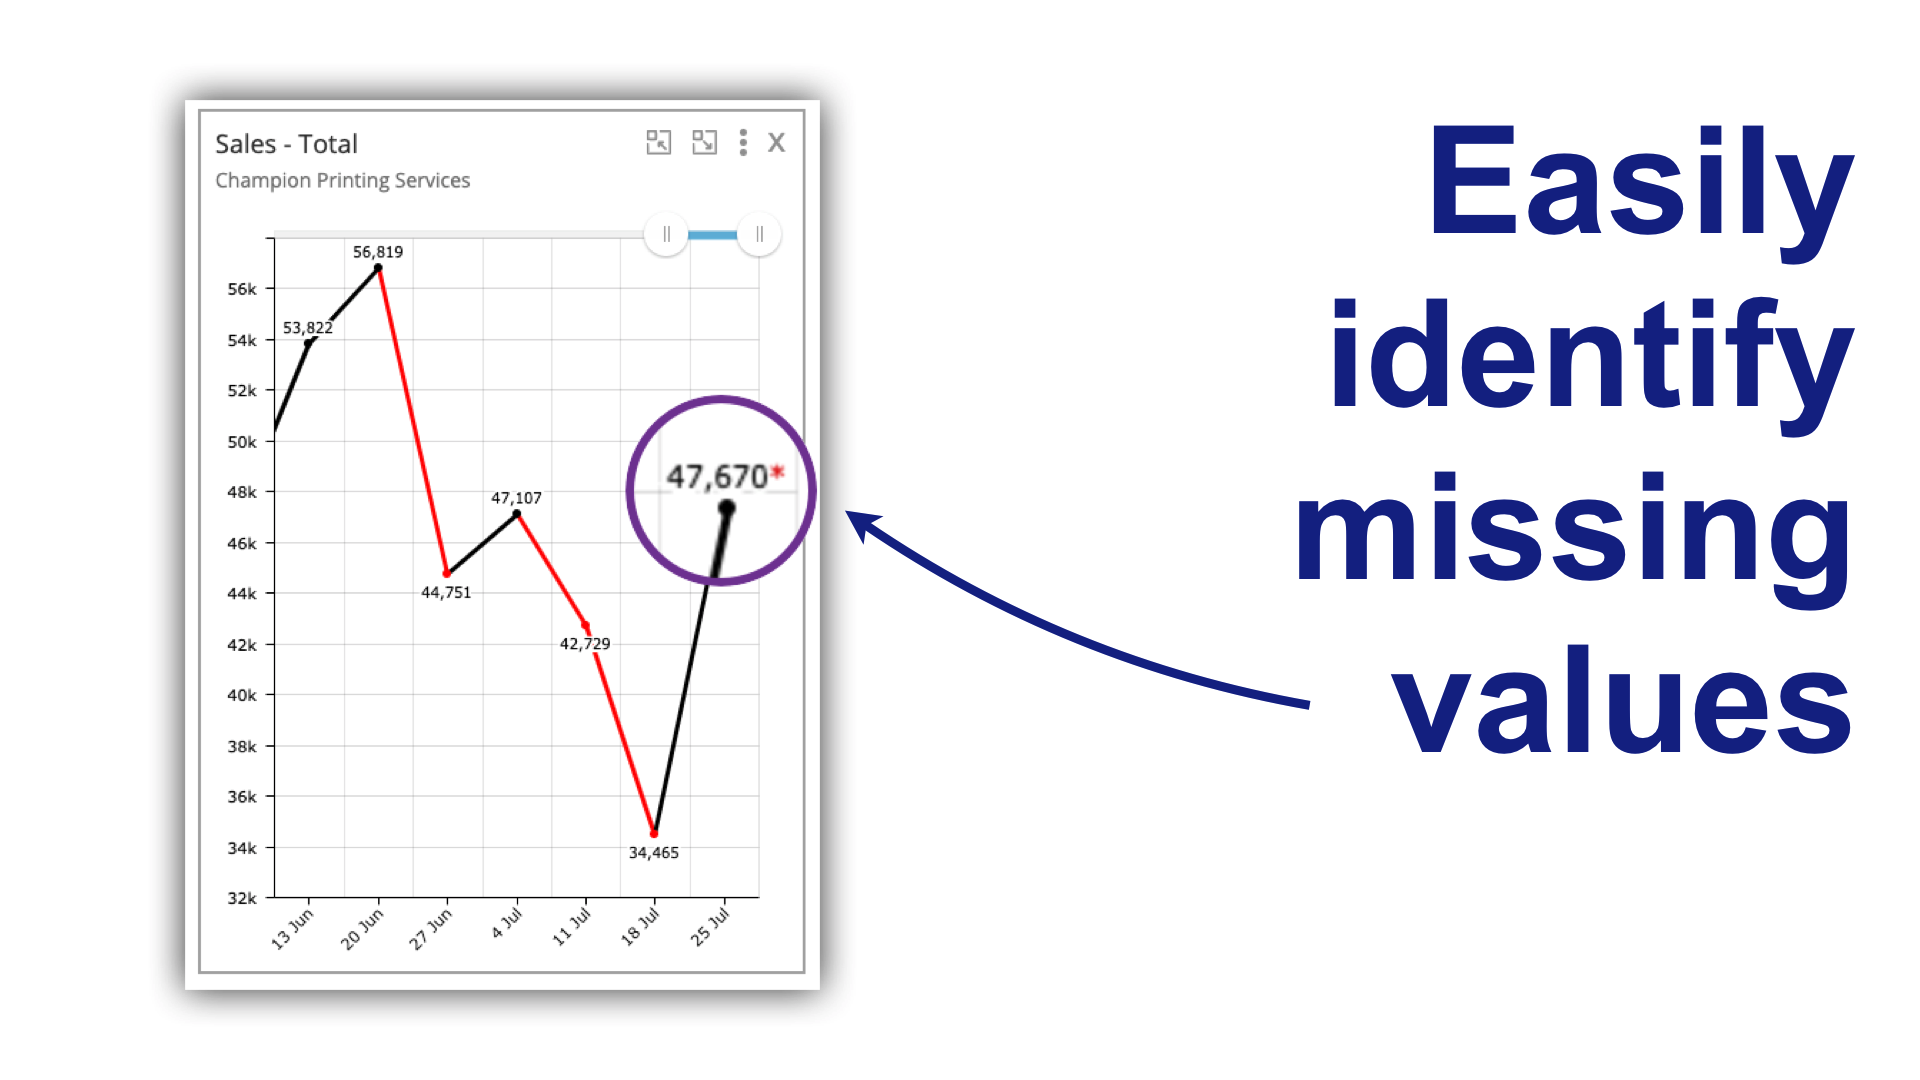
The Total Sales Graph below is a calculated graph that automatically totals the results from the entire sales team, comprising Joe, Sam and Sharon. Richard, marked in grey, represents an archived graph that is still included in the calculation. (Richard no longer works for Champion Printing and to find out why, read our book Rise of the Champions.)

Notice the last value on the Totals Sales graph has an asterisk. This indicates that one of the sales team members has failed to enter their statistics.

By clicking on that value, we can drill down into the detail.

Joe and Sharon’s values are in black, so we know they have reported their daily sales. Sam on the other hand has red values. This indicates that Sam has failed to enter his sales stats for at least one day.
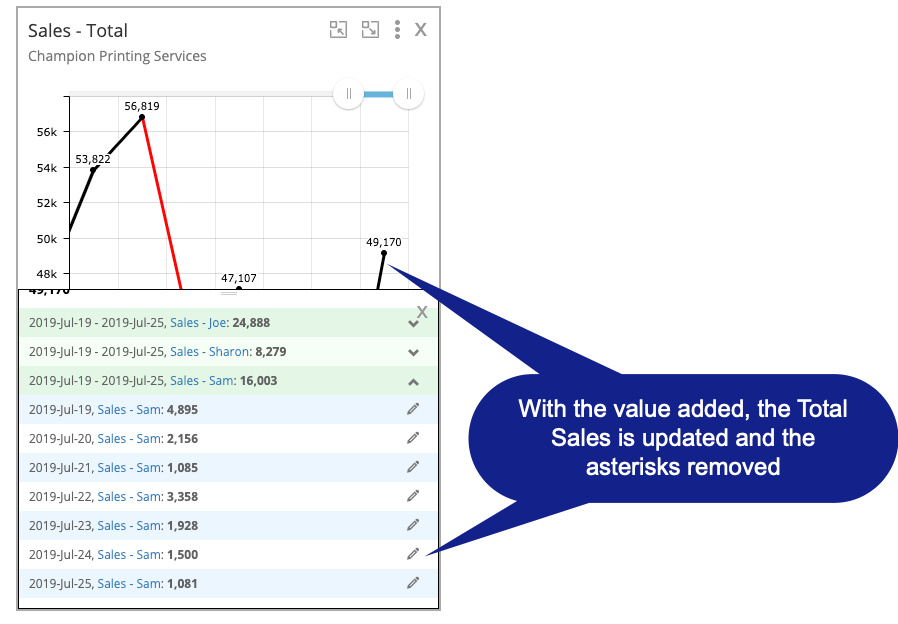
Clicking on the down arrow extends Sam’s results and we can see he didn’t report his sales statistic on the 24th July. Perhaps he had a day off or possibly he just forgot. Whatever the reason, we can easily update his results right from the Totals Graph.

Let’s assume Sam made some sales and simply forgot to enter them. Joe, the Sales Manager responsible for reporting the Sales Totals calls Sam and confirms what he sold that day and updates the total.
When using calculated graphs, being able to immediately identify missing values or no reports is a vital tool to ensure that everyone on your team is playing to win.
Try envisage for free.
Comment and asks questions below or ask questions privately.
And hit the heart if you like it.