

Time can be a problem. You think there are 365 days in a year, right?
Nope, there’s 365.2422. This is a rather inconvenient number so it’s rounded up to 365.25 and we have a leap year every 4 years to account for that annoying extra quarter day each year.
No big deal. But consider this: a vital element in monitoring statistics in your business is accuracy and precision.
You want to ensure that if you earn $9,876 in a week, that this is the precise, exact amount, it doesn't get rounded up or down. It's exact and precise.
Statistics are measured against units of time. But these units of time are not always consistent or equally divisible.
Take months for example. Some have 30 days and others have 31. And poor February has only 28 so that's why it gets the leap year bonus day.
And when it comes to a week, which is 7 days, notice how neither 30 or 31 is precisely divisible by 7. So a month consists of either 4.28 weeks or 4.42 weeks, unless it’s February which is a nice round, perfect and precise 4 weeks … unless its a leap year!
This becomes a problem when you try to view your statistics weekly or monthly. There is no easy way to convert it. The only solution we could offer was to recommend inputting your stats daily. But we know this is not always possible.
So we decided to solve this problem once and for all. We had two options:
We considered offering up a new calendar and getting everybody in the world to agree to a 5 day week, because 365 divided by 5 equals a nice round 73 weeks and just skip months entirely because they are annoying (mathematically speaking).
Another way to solve the problem was to recode envisage to cater for our imprecise calendar system. Despite the challenge and to save YOU the time of learning the new 5-day-week calendar, we took the harder route and worked on the code.
And now we’ve solved time for you (you’re welcome).
You can now easily convert a WEEKLY graph to a MONTHLY graph and have the data displayed with precision.
Here’s how it works.
The following Income Graph is a weekly graph by default which can also be viewed monthly.
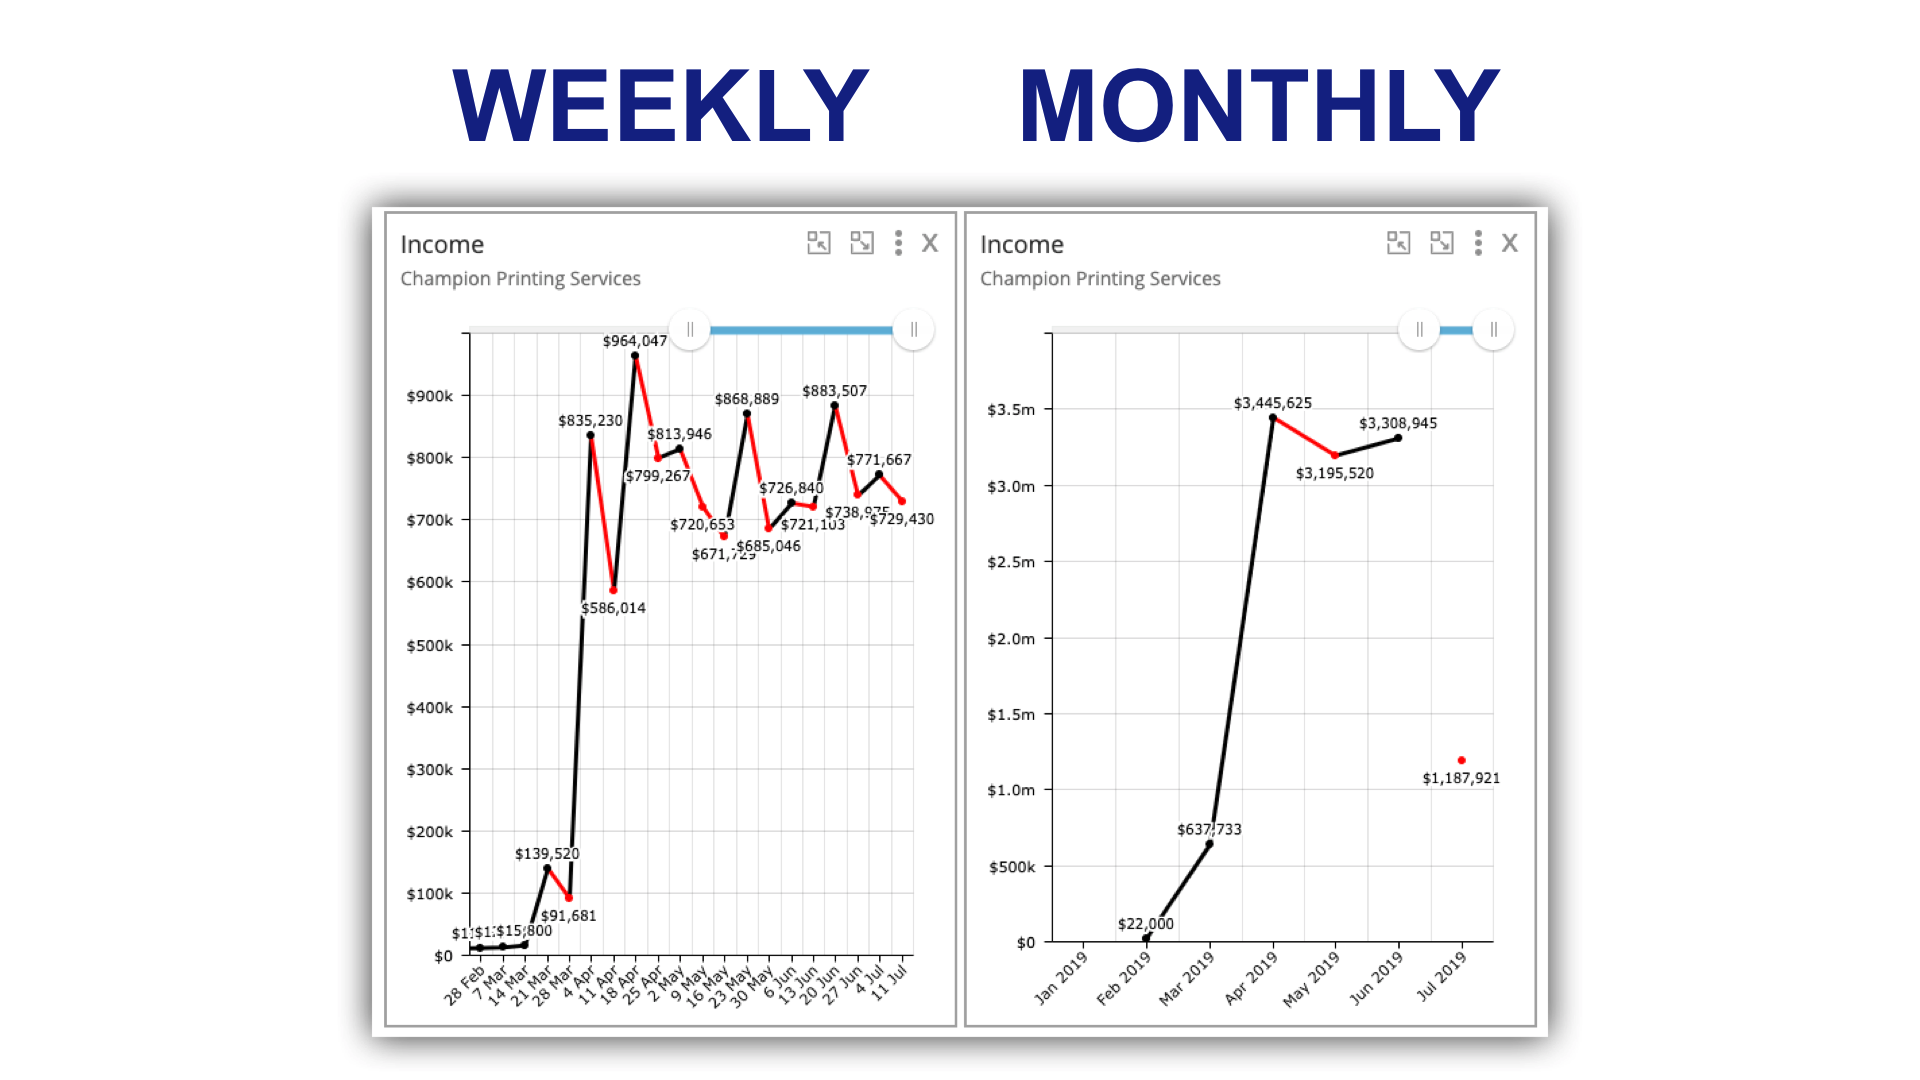
Envisage will automatically split weekly values that cross over to another month as shown below.

You can edit or merge these values as you please.
Now for those of you who have being tediously entering statistics daily (so you could switch between weekly and monthly views with accuracy) you can now convert your graphs to weekly if you want. See this help doc for more information on how to do this.
Comment and asks questions below or ask questions privately.
And hit the heart if you like it.