• Home
  • Blog
  • GMSC
    • Our Mission
    • Meet the Team
    • Careers
  • Bookstore
  • Contact
  • Search
  • Try MetaPulse →
Menu

MetaPulse Blog

101 California Street, Suite 2710
San Francisco, CA, 94111
+1 (415) 881-7952
Know how to grow with the world's first Growth Management System.™

Your Custom Text Here

MetaPulse Blog

  • Home
  • Blog
  • GMSC
  • About
    • Our Mission
    • Meet the Team
    • Careers
  • Bookstore
  • Contact
  • Search
  • Try MetaPulse →

Use the Org Chart Feature to Map Workflows

February 20, 2020 MetaPulse Team
Map Workflow Blog header.png

You don’t need to create an entire org chart before you benefit from the Org Chart feature, instead you can start with a simple workflow. 

Let’s use Champion Printing as an example.

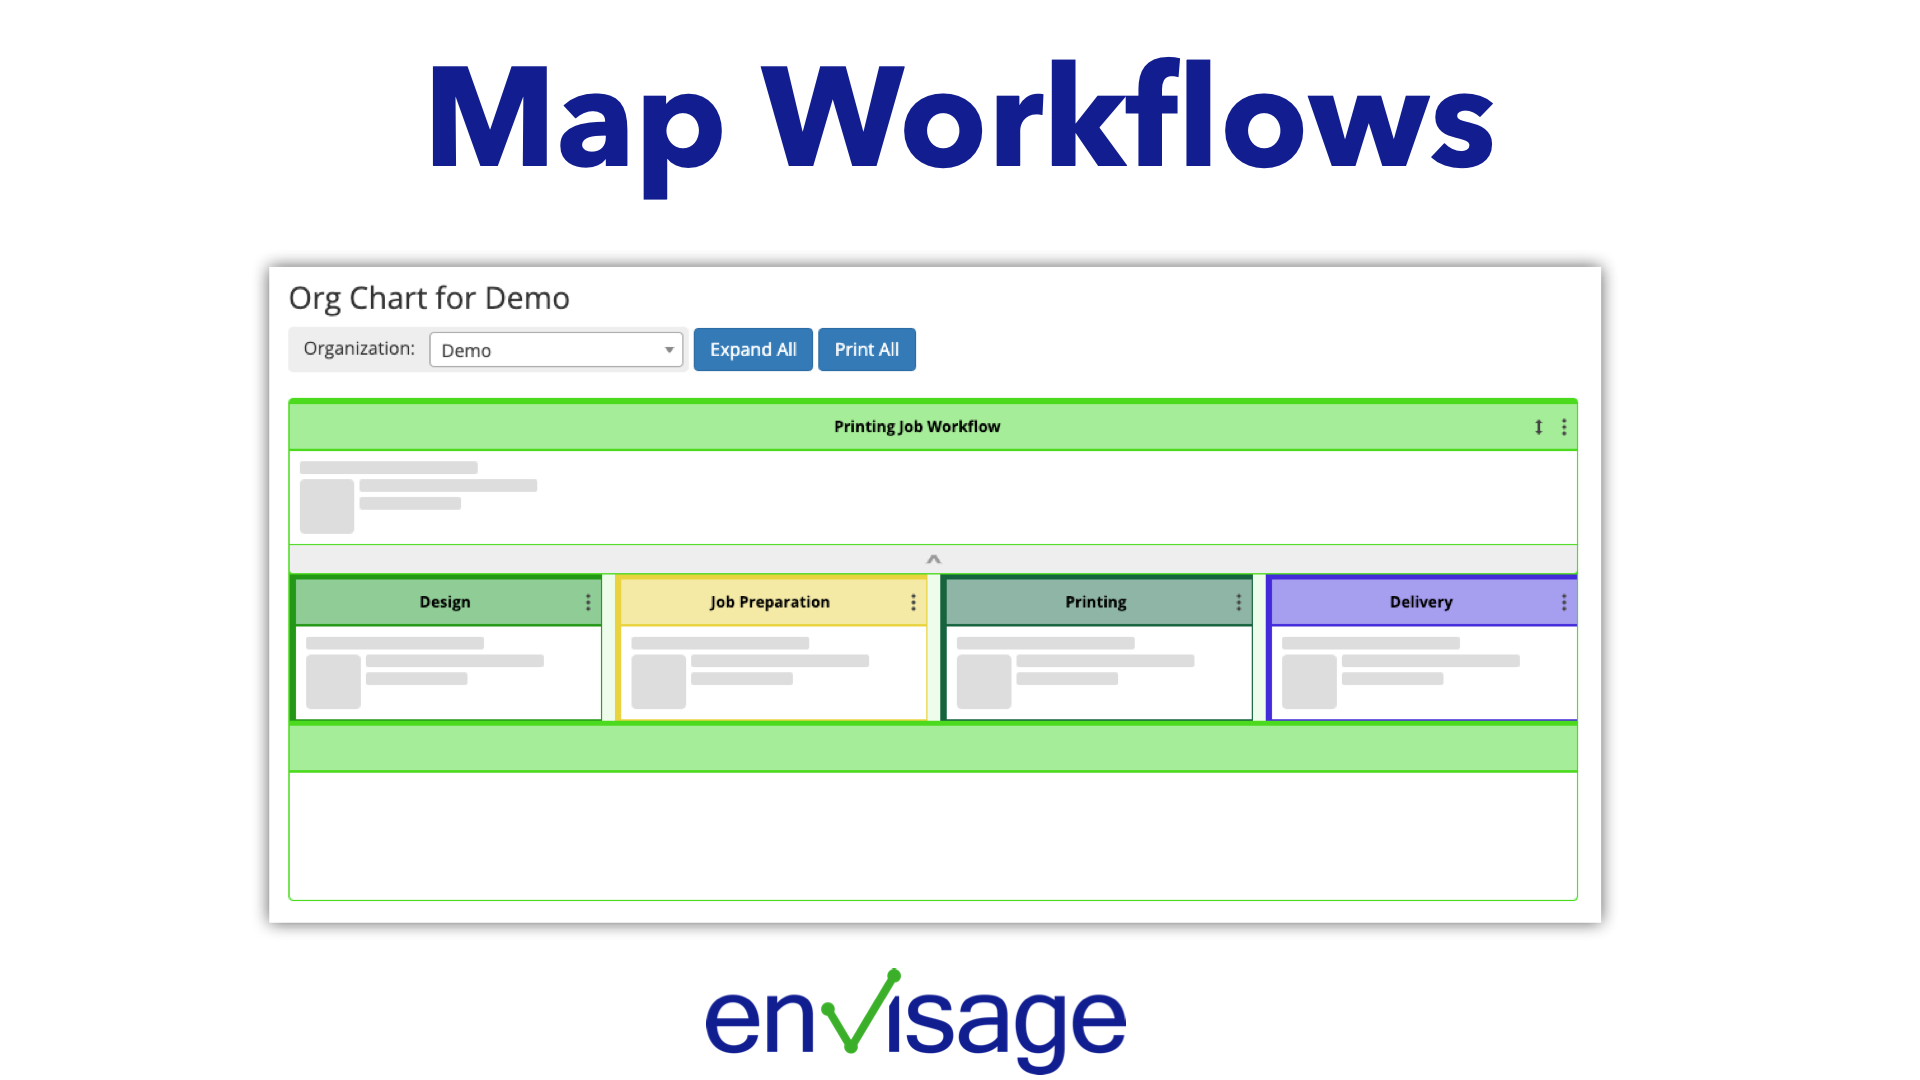
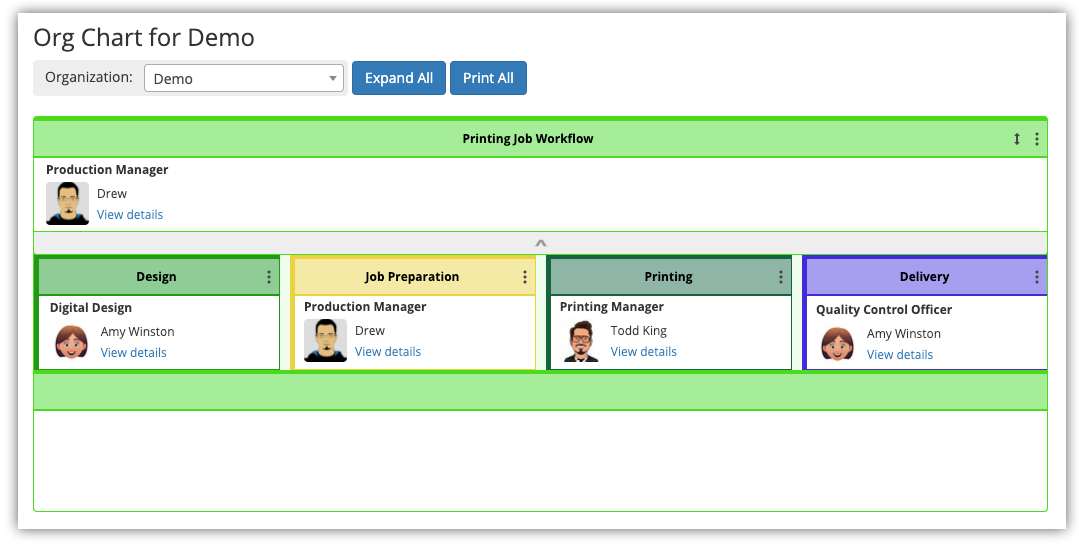
They have a basic workflow for all printing jobs, like so:

  1. Design

  2. Job Preparation

  3. Printing

  4. Delivery

Let’s say a different person is responsible for each role.

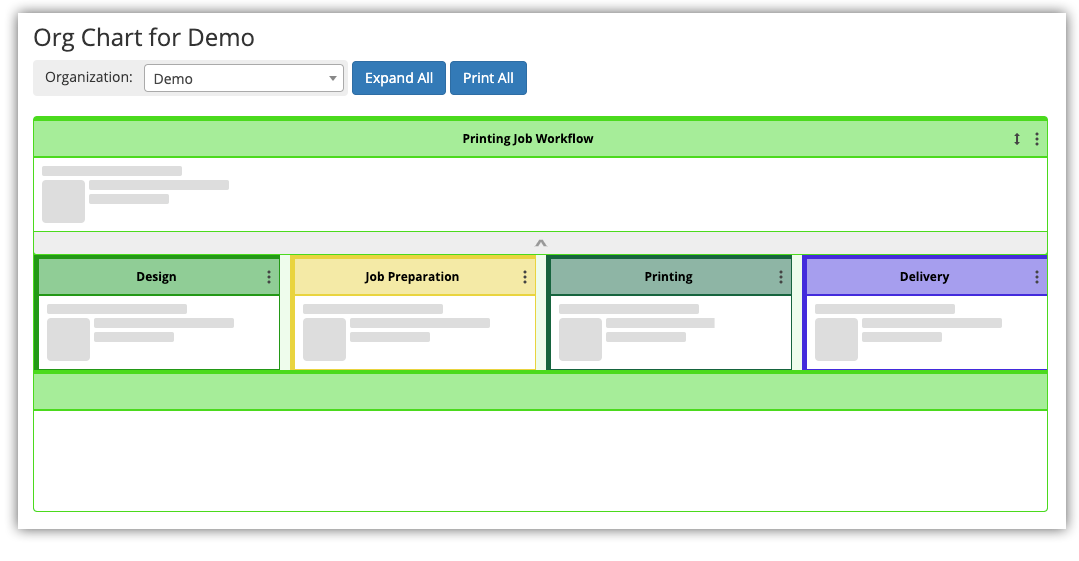
You can easily create this workflow using the Org Chart feature in envisage. Here’s what it looks like: 

org chart workflow .png

With this basic workflow created, let’s add the people.

org chart workflow - post names.png

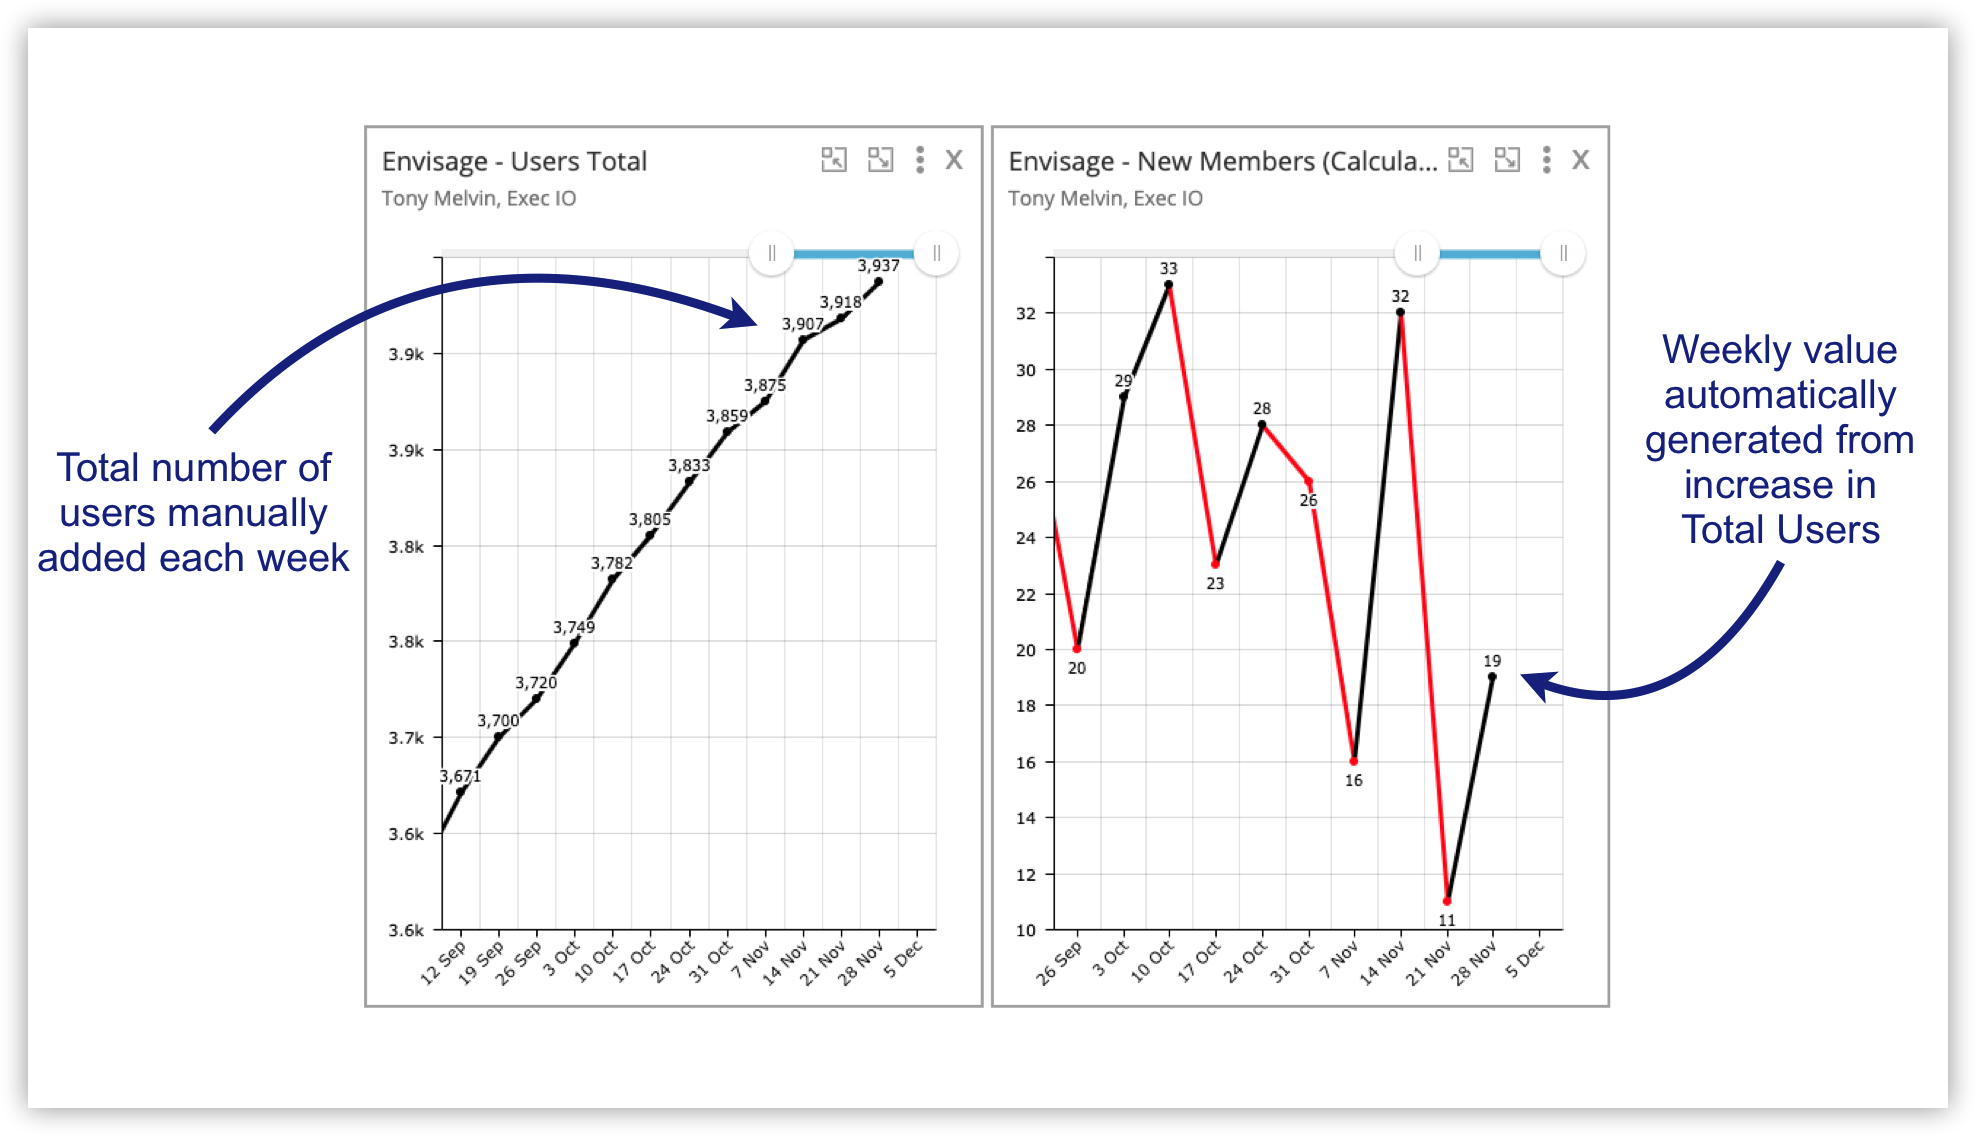
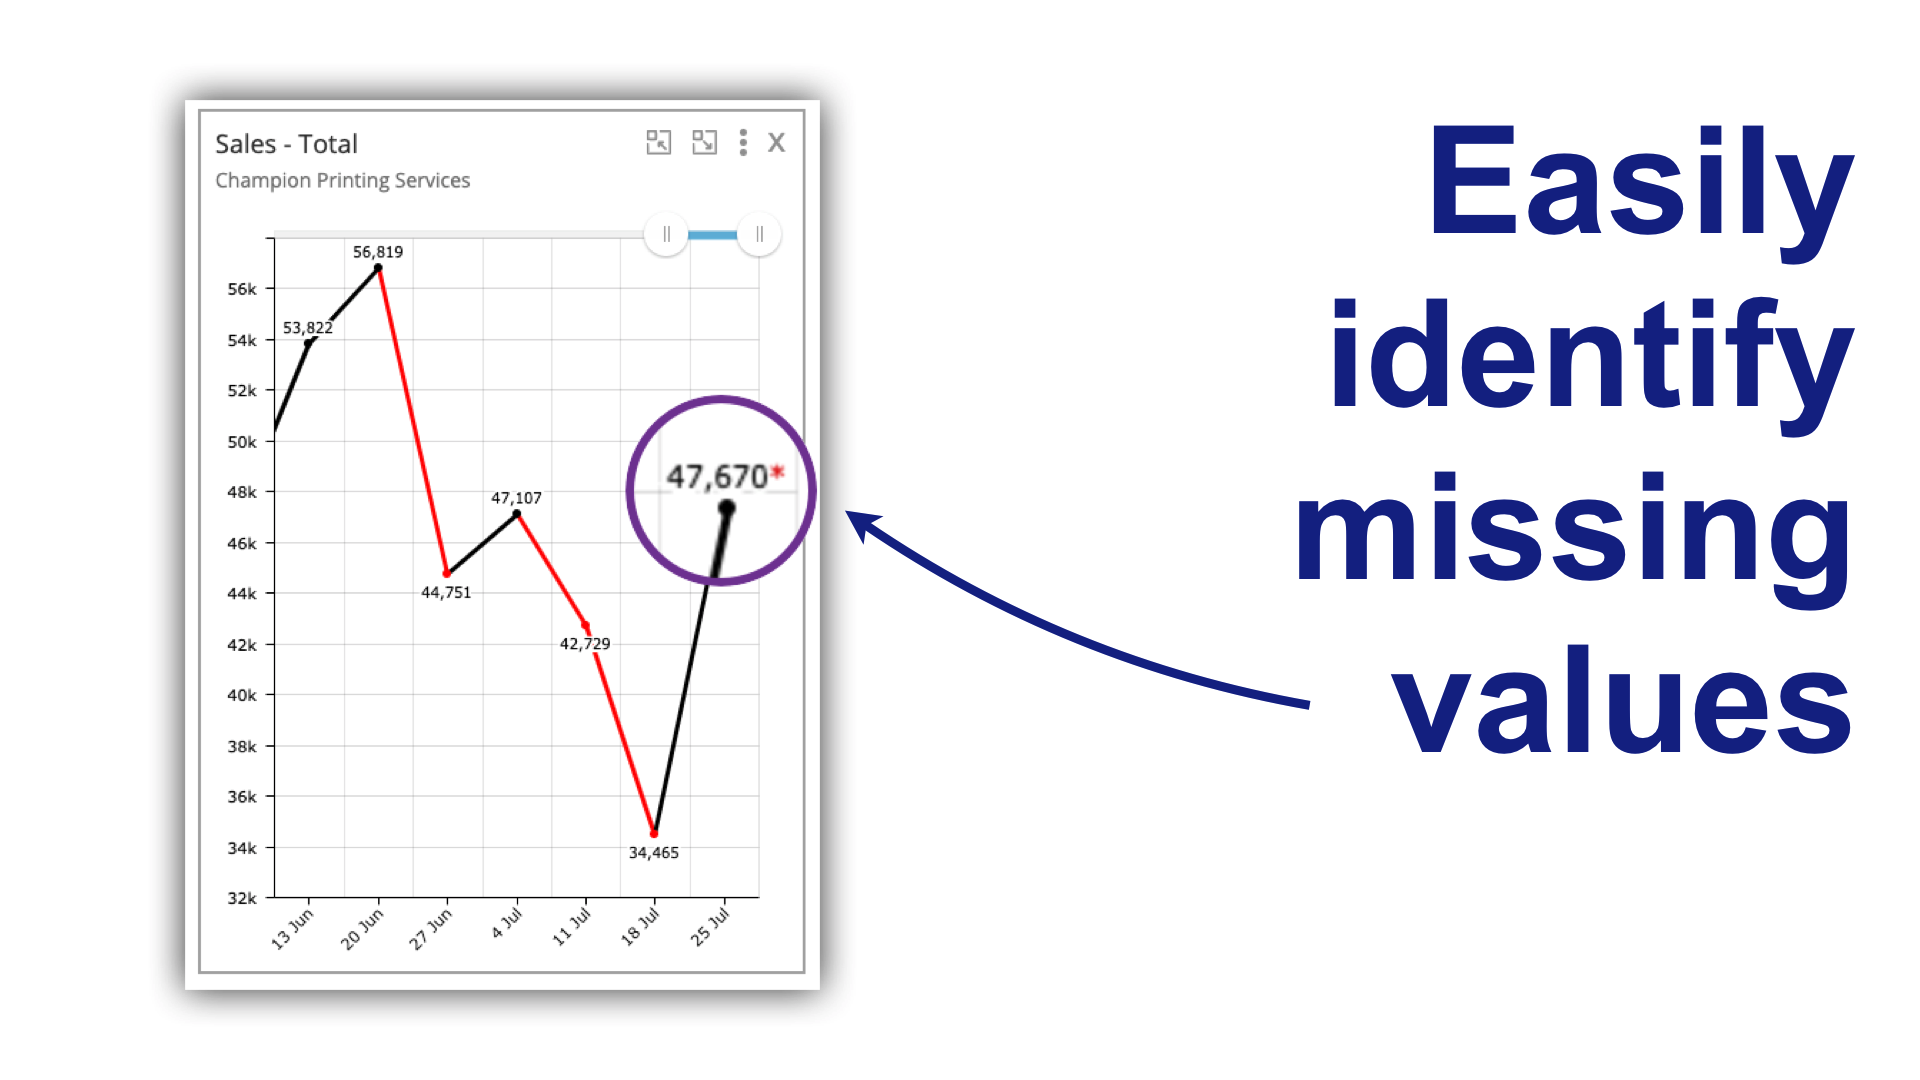
Now we can assign a statistic to each individual that measures the results of each step of this workflow. 

This simple application of these powerful envisage features will help create a coordinated team and improve the results of this small, yet important section of the organisation. 

You can view this vertically as well:

org chart workflow - vertical.png

Go ahead and create a simple workflow in envisage today.

You can create as many as you want. Gradually implement a workflow for each area of your organisation and eventually you’ll create your entire org chart. Here’s how to get started.

If you need help be sure to reach out to our support team.

And remember envisage includes Statistics, Org Chart and OKRs and you can try for free on a no-risk 14-day trial. We’ll even help you set up all your existing statistics to make sure you succeed in getting your business onto Envisage. 

Comment and ask questions below or ask questions privately.

In Best Practice Tags Org Chart, Work Flows
Comment

Still using spreadsheets to track your stats? Save time with MetaPulse.

January 30, 2020 MetaPulse Team

Clients never cease to be amazed at the amount of time they can save when taking advantage of the features in MetaPulse age. 

Here’s some common scenarios we’ve come across: (And if any of these apply to you, we can save you a lot of time.)

  1. It takes you more than 1 hour per week to work out the stats and enter them into your existing system.

  2. You add stats daily to a spreadsheet and then tally them for your weekly or monthly stats.

  3. You manually add up different stats using a calculator.

  4. Your stats are spread across several different spreadsheets.

  5. You track the stats by paper and spend hours entering them into a system.

  6. You have to constantly chase your team to report their stats to you.

If you’re suffering from any of the above, we can help streamline your stats reporting process. We’ve helped many clients save countless hours collating a myriad of numbers.

Entering statistics should be a simple and easy task. More time should be spent on analyzing and implementing solutions to improve those statistics.

Need help? Reach out via support  or just reply to this email and we’ll help you get set up. 

Remember you can try MetaPulse for free on a no-risk 14-day trial—it includes stats, org chart and objectives. We’ll even help you set up all your existing statistics to make sure you succeed in getting your business onto MetaPulse. 

Comment and ask questions below or ask questions privately.

In Best Practice Tags stats, analytics
Comment

Achieve your business goals in 2020 with Objectives

January 7, 2020 MetaPulse Team

Last month we released our long awaited objectives feature.

It’s a powerful system used by tech giants such as Google, Linkedin and Intel.

For over 6 months we’ve have this feature thoroughly tested with a select few of clients and now it’s ready for you to use.

Let’s take a look at how you can use Objectives to achieve your business goals for 2020...

Read more
In Best Practice Tags OKRs
Comment

Save time - Use a cumulative statistic to automatically track a weekly statistic

December 19, 2019 MetaPulse Team
total users and weekly new users.png

With some statistics it’s easier to track the cumulative or total.

For example, in envisage we track our Total Users, which is growing every day.

Rather than work out the number of New Users manually, we do it automatically using the total. This saves extra data entry and time.  

This method takes advantage of the Offset feature.

Here’s how it works...

Read more
In Best Practice Tags calculated graphs
Comment

Permissions Settings Linked to the Org Chart

November 9, 2019 MetaPulse Team
org chart permission settings.png

We’ve long had the ability to set permissions for graphs using Teams, that has allowed you to easily restrict access to graphs.

Now we’ve taken the permissions setting one step further and integrated them into the Org Chart.

Here’s how it works …

Read more
In Best Practice
Comment

Use Quotas and Targets to Get More Done

October 30, 2019 MetaPulse Team
QUOTAS AND TARGETS 2.png

The topic of setting goals and achieving them has been a topic of great discussion throughout the ages, from the ancient Greeks to modern day gurus and entrepreneurs. 

But did you know that envisage can help you achieve your goals faster? 

It’s a feature called Quotas and Targets, and here’s how it works... 

Read more
In Best Practice Tags Stats, OKRs, analytics, Org Chart, quotas, targets
Comment

Statistics that follow you around the Org Chart … no matter where you go!

October 9, 2019 MetaPulse Team
concatenate - intro.png

As your business expands, here’s one problem you’ll run into ...

What happens to the stats when a person changes their post in your business?

Should the existing graphs be assigned to a new person?

Or should you archive those graphs and create new ones?

Either solution creates more problems for management who need to be able to look back historically and see the actual stats for the post, as well as the individual.

Well, for those of you with big expansion plans, you’ll be happy to know we solved it.

And you’re going to love it. 

Here’s how it works…

Read more
In Best Practice Tags Stats, OKRs, analytics, Org Chart, advanced features
Comment

The best way to design your org chart! ... a 3-Step Process

October 4, 2019 MetaPulse Team
org chart post - assign.png

Creating an org chart is an insightful exercise for any business owner. 

One of the common realisations is - “Wow, look at all the hats I wear!”

In this article we’ll offer up some practice tips so you can take the next step … offloading some of those hats!

Here’s the first step: 

Read more
In Best Practice Tags Stats, OKRs, analytics, Org Chart
Comment

Why we don't charge per user and why it matters to you

September 25, 2019 MetaPulse Team
envisage pricing model.png

The most common pricing model for an app is to charge per user with restricted features based on price. Such models range from $10 to $50 per user.

But we decided on an entirely different pricing model.

Rather than charge per user, we decided to charge for USAGE with unlimited users. 

It’s a significant difference, both in price to you, but more importantly, in how you use our app.

Here’s an insight into our pricing model and a bold move that sets us apart from the competition ... 

Read more
In Best Practice Tags Stats, OKRs, analytics, Org Chart
Comment

Served anyway you like it - Daily, Weekly, Monthly, etc

August 28, 2019 MetaPulse Team
daily weekly monthyl.png

The popular calculated graphs feature in envisage allows you to apply any mathematical formula to your graphs.

While many users know and use calculated graphs to perform all kinds of functions, what you might not know is that you can also adjust the frequency of a calculated graph.

Let me show you how this works.

Read more
In Best Practice Tags OKR, Management, Analytics, Sales
Comment

Easily identify missing values and no reports

July 30, 2019 MetaPulse Team
easily identify missing values.png

Back in June we released a powerful new report feature that ensures everyone on your team is playing to win.

We’ve now enhanced this feature so you can easily see missing values or no reports.

Read more
In Best Practice Tags OKR, analytics, stats, Sales
Comment

When Average is better - An Introduction to the Status Statistic

July 22, 2019 MetaPulse Team
show average weekly monthly quaterly.png

Many businesses track statistics such as sales, income and leads. These are cumulative statistics where weekly values add up to monthly values. For example, 10 sales a week totals 40 per month (and with our new split values feature, you can be certain that envisage is reporting an accurately adjusted monthly value).

But what about a statistic like Bank Balance? This is not the type of statistic you want to “add up” when changing the frequency from days or weeks to months.

Read more
In Best Practice Tags stats, analytics, OKR
Comment

The problem of time solved - Great Scott!

July 12, 2019 MetaPulse Team
time problem.png

Time is a problem. You think there are 365 days in a year?

Nope, there’s 365.2422. This is a rather inconvenient number so it’s rounded up to 365.25 and we have a leap year every 4 years to account for that annoying extra quarter day each year.

No big deal? But consider this … A vital element of monitoring statistics in your business accuracy and precision.

You want to ensure that if you earned $9,876 in a week, that this is the precise, exact amount, it doesn't get rounded up or down. It's exact and precise.

Unfortunately statistics are measured against time and time is not very precise.

But what if you wanted an accurate MONTHLY value at the same time as having an accurate WEEKLY value? Well, we've solve it!

Read more
In Best Practice Tags stats, OKR, analytics
Comment

Save Paper - Use Share Links

July 4, 2019 MetaPulse Team

Go Paperless

Save time, money and the environment

If you’re endeavoring to create a “paperless office environment” then this article is for you.

Envisage makes it easy to share your graphs, without having to print.

This is especially useful for those with staff who work remotely, or for managers and owners who travel.

During our weekly meeting at exec.io we have people spread around the global, in Perth, Western Australia; Sydney on the east coast of Australia; and yours truly in Florida, USA.

So printing graphs for our team meeting is pointless.

Instead we use the share link. Here’s how we do it.

Read more
In Best Practice Tags OKR, stats, analytics, Management
Comment

KISS: Up = Good, Down = Bad

April 16, 2019 MetaPulse Team

Up is Good


Down is Bad

My version of the KISS principle is Keep It Super Simple.

I’ve written books on many complex subjects such as taxes, money management, investing and marketing. I often get feedback on how easy my books are to read. I go to great lengths to keep things simple.

The opposite of a KISS is a KICK - Keeping It Complicated Knowingly. I much prefer a KISS to a KICK.💋

Read more
In Best Practice Tags stats, business analytics, Management, OKR
Comment

When is a graph "down" ?

May 6, 2014 Mikel Lindsaar

Having different colours for up and down statistics is common, and nothing new.

It makes it simple to see if a chart is "going in the right direction" and is why all Envisage graphs are two toned. Black if the statistic is heading "up" in a better direction, and red if the statistic is heading "down". We chose black and red for many reasons, one of which is that red/green colour blind people can see the difference between black and red.

Read more
In Best Practice Tags analytics, Management
Comment
← Newer Posts
TRY envisage for 30 days
ASK US ANYTHING
 
MetaPulse RSS

chat with support.png
search the help center.png
schedule a free demo.png

Topics

Case studies
Best Practice
Business Coaching
Technology


Get free tips and insights once a week

We respect your privacy.

Thank you for joining and welcome to the team!


240px-Cc.logo.circle.svg.png
Cc-by_new.svg.png
 

© 2019 exec.io
except where otherwise noted content on this site is licensed under a Creative Commons Attribution-ShareAlike 4.0 International License.

PRIVACY POLICY | TERMS & conditions | COMMISSION DISCLOSURE