
With some statistics it’s easier to track the cumulative or total.
For example, in envisage we track our Total Users, which is growing every day.
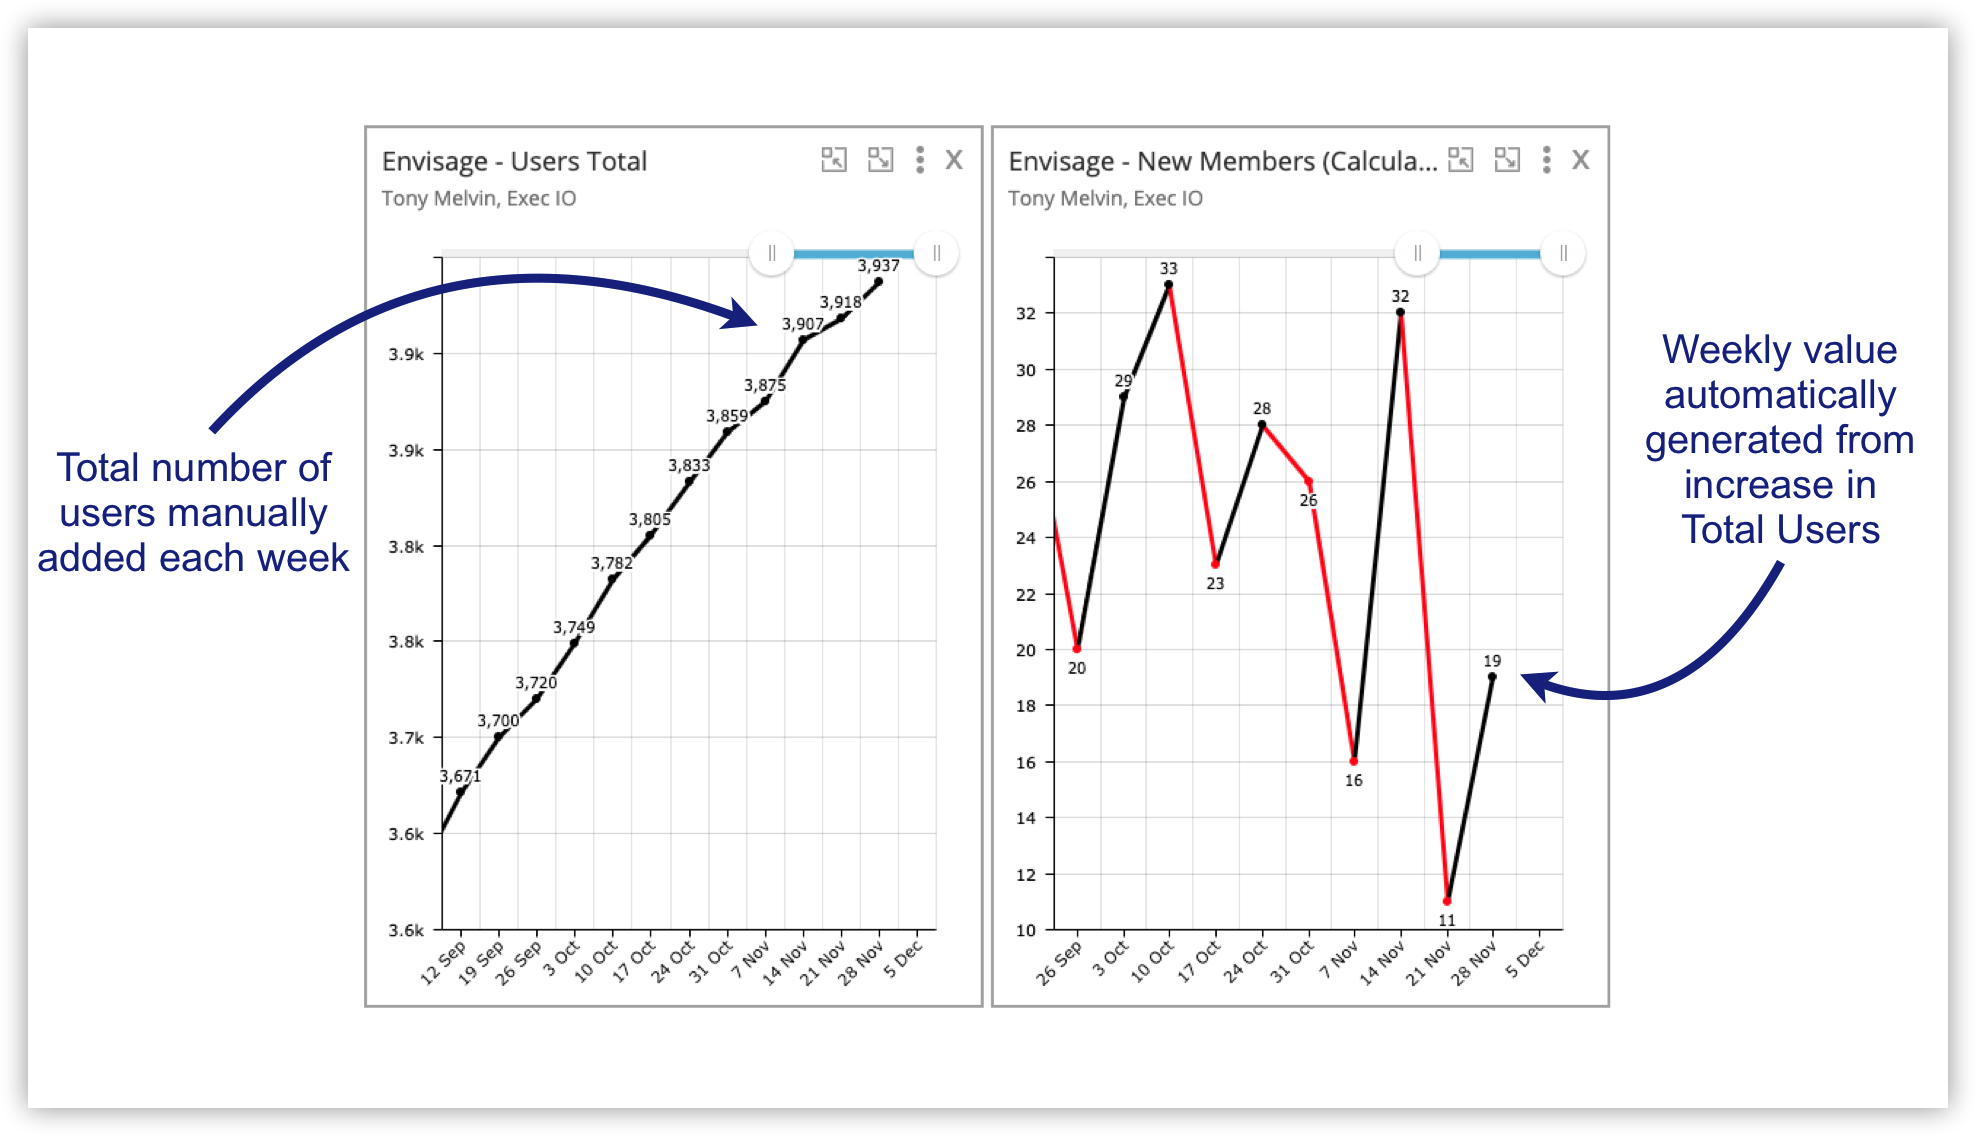
Rather than work out the number of New Users manually, we do it automatically using the total. This saves extra data entry and time.
This method takes advantage of the Offset feature.
Here’s how it works:
Each week we input the Total Users into the graph below.

To work out how many new users joined envisage in the past week, we simple minus last week’s value from the current total. Here’s the formula:
Total Users this week - Total Users Last Week = Number of New Users
We can do this in envisage using a Calculated Graph and the Period Offset feature, as shown below.

Using the method above has the following benefits:
The Total Users is an easy number to obtain
Data entry required for only one graph
Removal of potential human error working out the weekly stat
It saves time
This method can be used on statistics that naturally accumulate, such as:
Number of contacts in your database
Sales - both value of and number of sales
Number of staff
Company cash reserves
etc.
In the examples above, simply track the growing number each week and create a calculated weekly graph to figure out the difference.
That’s just a few ideas. The possibilities are endless. Give it a try.
And remember you can try envisage for free on a no-risk 14-day trial. We’ll even help you set up all your existing statistics to make sure you succeed in getting your business onto Envisage.
Comment and ask questions below or ask questions privately.