• Home
  • Blog
  • GMSC
    • Our Mission
    • Meet the Team
    • Careers
  • Bookstore
  • Contact
  • Search
  • Try MetaPulse →
Menu

MetaPulse Blog

101 California Street, Suite 2710
San Francisco, CA, 94111
+1 (415) 881-7952
Know how to grow with the world's first Growth Management System.™

Your Custom Text Here

MetaPulse Blog

  • Home
  • Blog
  • GMSC
  • About
    • Our Mission
    • Meet the Team
    • Careers
  • Bookstore
  • Contact
  • Search
  • Try MetaPulse →

5000 and counting

October 22, 2020 MetaPulse Team
thank you - 5000 users.png

We’re truly thrilled to announce that we recently surpassed over 5000 users!

We’d like to take this opportunity to thank you all for your loyalty and trust.

We plan to end this year with a bang by releasing some amazing new features. We will tell you more soon!

In the meantime, remember we offer full onboarding for your entire team, so if you need help, let us know.

oOo

Know how to grow with envisage! The world’s first Growth Management System™ Application with Statistics, Org Charts, Objectives, Trends, Events and Reports. Try for free on a no-risk 14-day trial. We’ll even help you set up all your existing statistics to make sure you succeed in getting your business onto Envisage. 

Comment and ask questions below or ask questions privately.

In Case Study Tags stats, OKRs, analytics, Org Chart
Comment

Onboarding Success!

October 12, 2020 MetaPulse Team
onboarding success.png

Several weeks ago we launched free onboarding sessions to help you get the most out of envisage and to help you grow.

We’ve had a tremendous response and wanted to share with you some of the wins from our clients.

I really appreciate the help getting [envisage] set up as it has a lot of functionality. I have had issue[s] with other similar [apps] before [where] it never gets fully set up and fails right away. From the work already put in, I can tell the envisage team is really gunning for our success.

— Rob Whitt, TheBusinessAcademy.com

The onboarding session was very helpful. It really gave me an understanding of how easy it is to use envisage.

— Konstantine Rizopoulos, PT, www.HandsOnPT.org

Being over 60 with little tech background I have used support a lot and each time they have helped me a lot. Also our sales have increased over the last 3 months by 40% as each sales person’s sales are getting seen by all the other staff and no-one wants 2 red down lines in a row, it creates a demand to increase productivity more than any nagging will achieve. Brilliant tool for management.

—Ken Warren, australianmarketinglist.com.au

Envisage seems really simple to use ... and definity once it's set up. And with the Envisage team's onboarding and dedication to helping its clients use the [app] effectively, I have no doubt that this is the [app] that will create the transparency and data needed to truly manage our business and execute our expansion plans. 

— Rob Whitt, TheBusinessAcademy.com

I must say, envisage Customer Service stands apart from any other company's customer support, anywhere I deal with. I loved it when [they]  took me on a Tour so I could [use it] as a whole better.

— Priscilla McPhaul, thecustomerfactory.net

The support provided by Envisage is stellar! Very fast responses and always a great solution! 

— Codi-Rose Filios, stepandrepeatla.com

I've used a few different statistics programs, and Envisage has by far been my favorite. It's easy to use and does everything I need. They've got a great help section if I ever have any questions, or if I really get stuck with something, I know I can reach out to support and get a quick and helpful response. I love that they are constantly improving and adding new features as well. The new org chart feature is a game changer!

— Abby Johnson, Certified Profit First Professional, www.matterhornbizdev.com

I just cannot say enough good things about the Envisage Team! They have saved me hours on a quarterly report I do and have been available to help me troubleshoot some other issues. I went from dreading these reports to almost looking forward to it. (I mean, let's be honest, you would know I was lying if I said I wanted to do them.) The envisage team are wonderful.  

— J.S.

Envisage has been available for a support issue and stayed with it until it was resolved. Very helpful crew!

— Stan Dubin, employeetestingcenter.com

If you need help let us know, we offer full onboarding for your entire team.

oOo

Know how to grow with envisage! The world’s first Growth Management System™ Application with Statistics, Org Charts, Objectives, Trends, Events and Reports. Try for free on a no-risk 14-day trial. We’ll even help you set up all your existing statistics to make sure you succeed in getting your business onto Envisage. 

Comment and ask questions below or ask questions privately.

In Best Practice Tags Success Stories
Comment

Org Chart: Temporary Post Feature

October 6, 2020 MetaPulse Team
org chart temporary post-2.png

As an organization grows and changes, a person sometimes needs to take on a role that is not part of their usual duties. 

Often these extra duties do not require a full-time employee, but still need to be assigned to someone.

That’s why we created the Temporary Post.

Here’s how it works...

We’ve added the ability to assign a post as “Permanent” or “Temporary” as shown below.

org chart perm or temp post.png

The Temporary Post feature can also be used for temporary staff who are hired for a brief period of time. 

For more information see our help docs on Creating a Temporary Post and Creating Hats and Adding Posts to the Org Chart.

It’s another way envisage helps you grow!

Let us know if you need help, we offer full onboarding for your entire team.

oOo

Know how to grow with envisage! The world’s first Growth Management System™ Application with Statistics, Org Charts, Objectives, Trends, Events and Reports. Try for free on a no-risk 14-day trial. We’ll even help you set up all your existing statistics to make sure you succeed in getting your business onto Envisage. 


In New Features Tags Org Chart
Comment

Make a Phone Call Direct from the Org Chart

September 28, 2020 MetaPulse Team
org chart - member details.png

The Org Chart is the central hub of envisage. With it you can coordinate all activities, manage your team and even make a phone call!

Here’s how it works:

org chart - make a call.png

Firstly, you need to add the contact phone numbers for all members. If you have a large team we’ve made it easy for you to add or update your entire team.

Once the phone numbers are added to each member, they’ll show up in the member’s post details via the org chart, as shown above.

Simply click on the phone to activate your computer’s phone software (such as Facetime, Skype, Google Hangouts) or your company’s VoIP system. You can also sync your phone to your browser and have the call “sent” to your phone. Just google “how to make a phone call with [enter browser name].”

This is another simple feature that helps team communication and coordination, all to help you grow!

If you need help creating your org chart in envisage, let us know, we offer full onboarding for your entire team.

oOo

 Know how to grow with envisage! The world’s first Growth Management System™ Application with Statistics, Org Charts, Objectives, Trends, Events and Reports. Try for free on a no-risk 14-day trial. We’ll even help you set up all your existing statistics to make sure you succeed in getting your business onto Envisage. 

Comment and ask questions below or ask questions privately.


In New Features Tags Org Chart
Comment

To Delete or Archive? That is the Question

September 22, 2020 MetaPulse Team
dont delete better to archive-2.png

In the ongoing progress of making envisage the foremost Growth Management System™ application ever, we’ve added an important feature on how members are “removed” from the system.

Until now, the only way to remove a member was to delete them. This meant that the graphs and objectives assigned to that member had to be either deleted or archived too. It also meant that the connection between the individual and the result was severed. 

Trying to figure out 2 years from now who achieved result “X” was cumbersome.

That’s why we’ve added the ability to archive a member. This means that the individual can no longer access your envisage organisation, but all information remains accessible, so you can still see who created what result, even when they’ve left the company.

We also prevented a member from being removed if they have assigned graphs, objectives, posts and events. 

Here’s the choices you now see in the Member settings:

edit memeber settings.png

And when you choose “Archive Member,” you’ll see this warning.

archive member warning.png

It’s another useful tool that helps you manage growth.

Of course, the first step is having all of your members using envisage and posted on your org chart. If you need help creating your org chart in envisage, let us know, we offer full onboarding for your entire team.

And check out our help docs for more information on How to Archive or Remove a Member.

oOo

Know how to grow with envisage! The world’s first Growth Management System™ Application with Statistics, Org Charts, Objectives, Trends, Events and Reports. Try for free on a no-risk 14-day trial. We’ll even help you set up all your existing statistics to make sure you succeed in getting your business onto Envisage. 

Comment and ask questions below or ask questions privately.

In New Features, Technology Tags Stats, OKRs, Analytics, Org Chart
Comment

Org Chart: Assistant Feature

September 17, 2020 MetaPulse Team
org chart assistant feature-2.png

CEOs and managers often have assistants who help them get more done. Occasionally, the assistant acts on behalf of the manager. 

In many cases, the assistant needs the same level of permission access as the manager or executive they work for. 

In envisage, we have created Assistant Post features which cater for the needs of this vital role.

Here’s how it works:

As we discussed in a prior article, the In Charge Feature provides an easy way for managers and executives to get full access to their juniors on the org chart. 

The assistant feature works in the same way. It provides the same access level to graphs and objectives as the Manager they assist, making it easier for the assistant to coordinate their team’s activities.

The assistant hat is highlighted by either a shaded area or a floating node as shown above. 

It’s another useful tool that helps you organise and monitor your team’s progress.

Of course, the first step is having an org chart! If you need help creating your org chart in envisage, let us know, we offer full onboarding for your entire team.

And check out our help docs for more information on Creating Hats and Adding Posts to the Org Chart.

oOo

Know how to grow with envisage! The world’s first Growth Management System™ Application with Statistics, Org Charts, Objectives, Trends, Events and Reports. Try for free on a no risk 14-day trial. We’ll even help you set up all your existing statistics to make sure you succeed in getting your business onto Envisage. 

Comment and ask questions below or ask questions privately.

In New Features Tags Org Chart
Comment

FREE MetaPulse Onboarding - It’s time to grow!

September 14, 2020 MetaPulse Team
Free Onboarding for all clients .png

Building an expanding and profitable business takes time and dedication.

While MetaPulse makes it easy to track statistics, implementing all of MetaPulse’s features also takes time and dedication. Often in business the important non-urgent tasks take a back seat to the urgent yet not-so-important ones. 

However, it’s the important tasks that help growth and profitability.

We understand this, which is why we built MetaPulse in the first place, so you can focus on what is important. 

It’s also why we’re introducing MetaPulse Onboarding.

Our team of trained Growth Management MetaPulse experts are ready to help you. We can: 

  • import all of your stats

  • build your org chart 

  • provide custom training for all of your team

  • help you implement objectives and key results (like google does)

  • help you plan using quotas and targets

  • remove bottlenecks and inefficiencies using Reports

  • save time with calculated and comparison graphs

  • create a log of successful actions with Events

  • easily track and monitor graph Trends

The best part is — Onboarding is currently being offered for free to all subscribed clients! 

To make MetaPulse part of your company’s DNA, it requires everyone onboard using the app, posted on the org chart, managing their stats and achieving objectives. 

We’ve seen first hand the truly amazing results that can be achieved when all features are utilised. 

As the world’s first Growth Management System™ Application — MetaPulse does what it was built to do — help you grow, help you expand, help you increase your sales and profits.

Despite the turmoil created by COVID, we’ve seen our clients expand and achieve their objectives when they use and apply the features available in MetaPulse.

To find out more contact us here or get started now and schedule your FREE MetaPulse Onboarding. We know we can help you grow. 

Know how to grow with MetaPulse! The world’s first Growth Management System™ Application with Statistics, Org Charts, Objectives, Trends, Events and Reports. Try for free on a no risk 14-day trial. We’ll even help you set up all your existing statistics to make sure you succeed in getting your business onto MetaPulse. 

Comment and ask questions below or ask questions privately.

In Best Practice, Book Reviews, Business Coaching, Case Study, New Features, Technology Tags Stats, OKRs, Analytics, Org Chart
Comment

Org Chart - In Charge Feature

September 4, 2020 MetaPulse Team
org chart in charge feature.png

The In Charge feature in envisage makes it easy for managers to coordinate their team’s activities. 

Several weeks ago we made a significant change to the way the org chart works—we now have Hats, Posts and Members.

Each hat on the org chart can be assigned the “In Charge” of that area. This automatically grants the In Charge with edit permissions for all their juniors on the org chart. 

This makes it easy for a manager to view and update graphs, objectives and monitor their team’s performance.

This applies across the entire org chart, permitting every manager from the top to the bottom, to effectively manage.

It’s another vital feature that enables hyper-growth. 

The first step is having an org chart! If you need help creating your org chart in envisage, let us know, we can help create it for you! See our help docs for more information on Creating Hats and Adding Posts to the Org Chart.

oOo

Know how to grow with envisage! The world’s first Growth Management System™ Application with Statistics, Org Charts, Objectives, Trends, Events and Reports. Try for free on a no risk 14-day trial. We’ll even help you set up all your existing statistics to make sure you succeed in getting your business onto Envisage. 

Comment and ask questions below or ask questions privately.

In Case Study, Best Practice, Book Reviews, Business Coaching, Technology, New Features Tags Stats, OKRs, Analytics, Org Chart
Comment

Easily compare this year to last year

September 1, 2020 MetaPulse Team
Last Year Comparison Graphs -2.png

Although you should track your stats on a weekly basis, it’s often good to know if you are beating last year’s performance.

You can do this using the Offset feature, now available with Comparison Graphs and Calculated Graphs. 

We’ve made an upgrade so you can easily compare different periods in any frequency, be it weekly, monthly, quarterly or yearly. Prior to this recent upgrade, the offset feature was limited to the graph's default frequency.

Let’s create a comparison graph to compare the current month’s Sales to the Sales of the same month last year. 

Creating an Offset Comparison Graph

First we create a new Comparison graph called Sales This Year / Last year. Then we added the current values and 12-month-offset values as shown below.

new comparison graph-2.png

End Result

Now you can easily compare your current results to the same period last year, whether weekly, monthly or quarterly. Simple hover to see the values and dates.

Last Year Comparison Graphs -2.png

For more information on how to create a “This Year / Last Year” comparison graph see Period Offset in Calculated Graphs and How to Create a Comparison Graph. 

Know how to grow with envisage! The world’s first Growth Management System™ Application with Statistics, Org Charts, Objectives, Trends, Events and Reports. Try for free on a no-risk 14-day trial. We’ll even help you set up all your existing statistics to make sure you succeed in getting your business onto Envisage. 

Comment and ask questions below or ask questions privately.


In Case Study, Best Practice, Book Reviews, Business Coaching, New Features, Technology Tags Stats, OKRs, Analytics, Org Chart
Comment

Instantly create a Current Target with a Click

August 14, 2020 MetaPulse Team
current target feature.png

What do you plan to achieve this week, month or quarter?

And how close are you to achieving this goal?

With our latest feature you can know both instantly.

We call in Current Target and here’s how it works.

Simply right click anywhere on the graph to open the Context Menu and click on Set Current Target.

Set the value and click save. That’s it, you're done! Target set. 

Just 3 simple steps as shown below.

set current target.png

If you hover over the target you can see your progress and how close you are to reaching it. 

current target feature.png

Current Targets work on all frequencies, be it daily, weekly, monthly and so on.

Current Target is available to all members, so go ahead and give it a try! 

And see our help docs for more information on how to use Current Targets.

Know how to grow with envisage! The world’s first Growth Management System™ Application with Statistics, Org Charts, Objectives, Trends, Events and Reports. Try for free on a no-risk 14-day trial. We’ll even help you set up all your existing statistics to make sure you succeed in getting your business onto Envisage. 

Comment and ask questions below or ask questions privately.

Comment

Fast as Lightning

August 6, 2020 MetaPulse Team
Photo by Sean McAuliffe on Unsplash

Photo by Sean McAuliffe on Unsplash

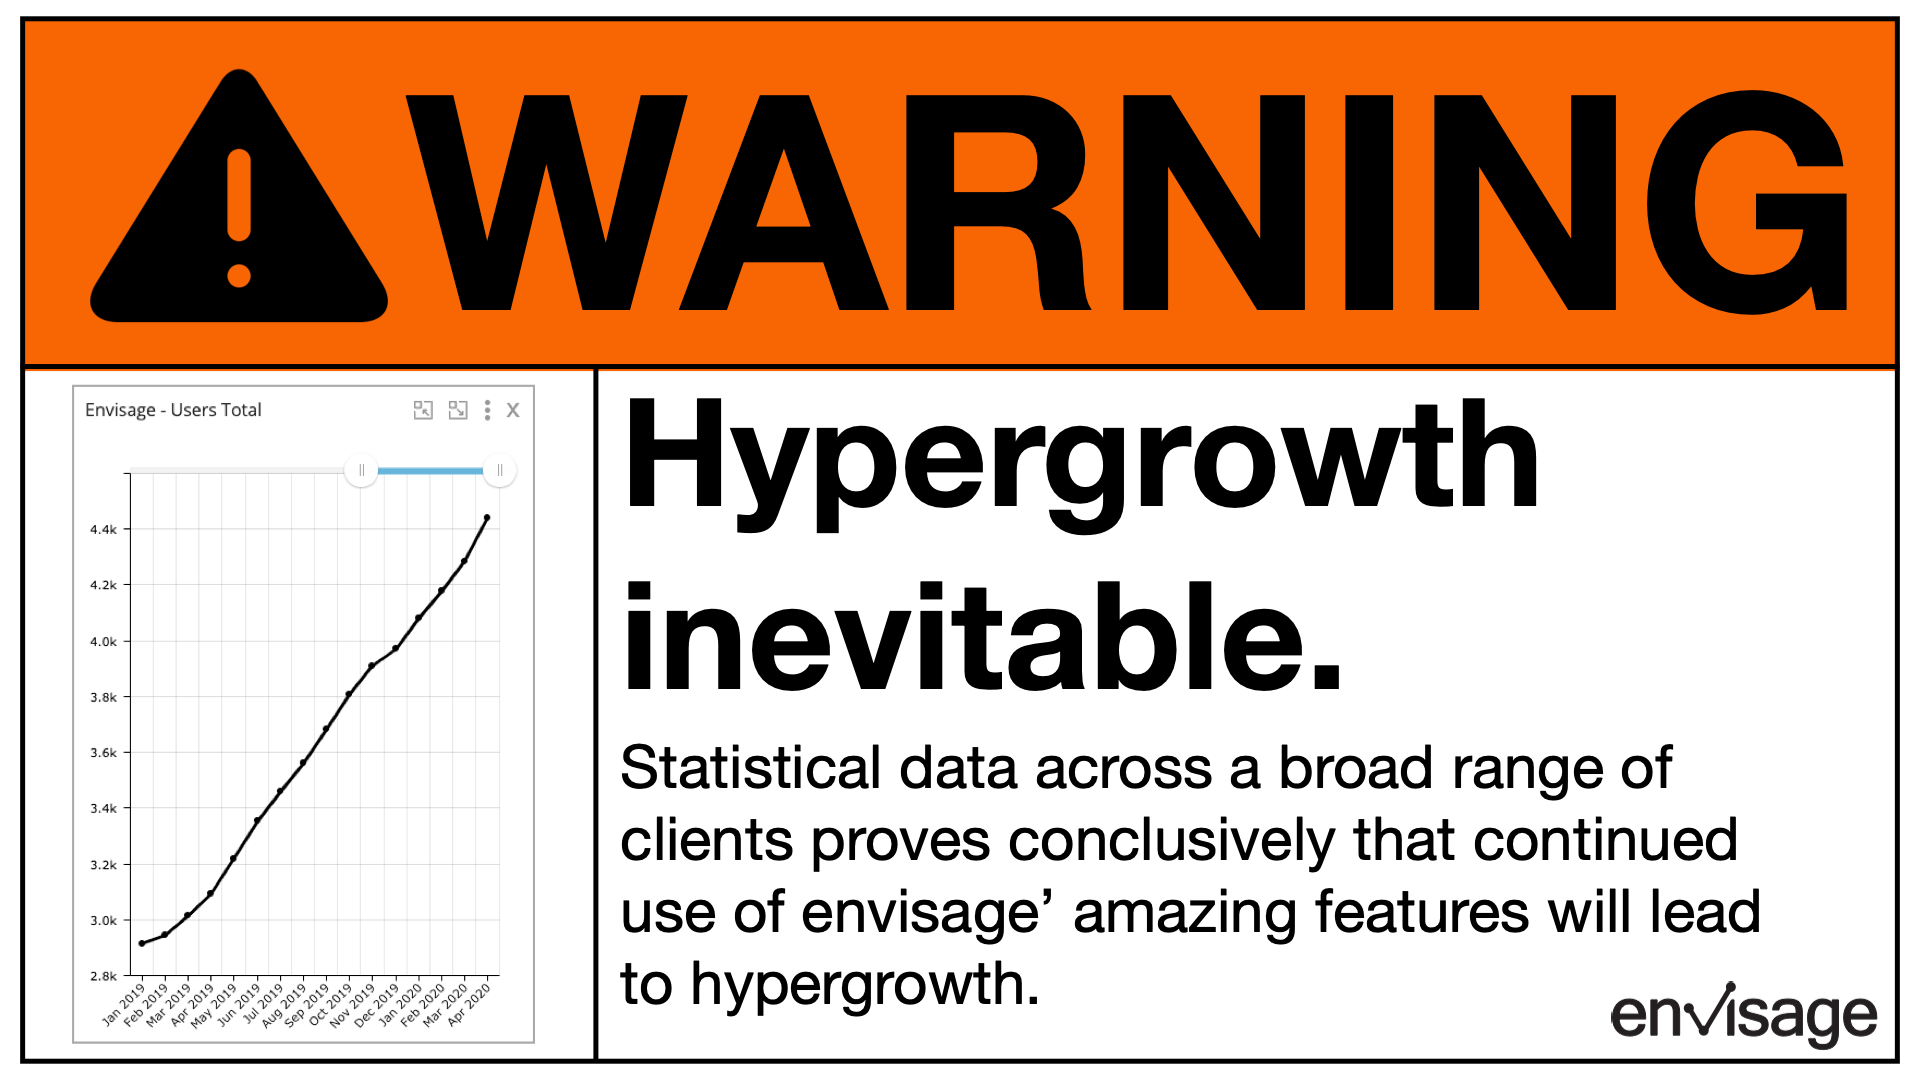
With just under 5,000 users logging in to update some 71,596 graphs, we took the next giant step to make envisage even faster.

What used to take minutes, now often takes less than a few hundred milliseconds (less than half a second).

Although a minute or two might not sound like a long time, keep in mind that a minute is a very long time in the computing world.

It’s about 600 times faster… so yeah… that’s a lot :)

How’d we do it? 

We changed two things.

Firstly, we changed the way calculated graphs work.

Secondly, we changed the way graphs display.

Realtime Calculated Graphs

Some of our users combine hundreds of graphs using our popular Calculated Graphs feature, adding together statistics from hundreds of sales people across multiple countries.  Prior to this upgrade, whenever a new value was entered, envisage would collect all of the data from each graph and perform a recalculation in the background. This task took a lot of time (many minutes sometimes) and also loaded up our servers with work. But worse, when you went to look at the graph, if it was still recalculating, all you got was the old data until it was ready.

Now, envisage calculates these values in realtime using highly tuned database queries specific to this task. The result is that the graphs update in realtime (in milliseconds).

For those of you with calculated graphs pulling data from many sources, you’ll notice a difference in load speed. You’ll also notice that we removed the “Recalculate” option from the graph menu as it’s no longer needed. You can read more about that here.  

Faster Display  

There are a tremendous number of variables involved in rendering a graph on your computer, such as the type of browser you use, your available computer memory, processing power, size of your screen, and internet speed — to name a few. 

Previously, envisage would load up to 10 graphs at a time in batches.  This meant that you would see about 10 empty graphs loading with spinners for a few seconds, then the next 10 would load and so on until all the graphs were loaded.

The issue with this method was that the speed of rendering was limited by the slowest graph. The browser had to wait until all 10 graphs had their data before it could display any of the graphs.  This meant that it felt slow and took longer to display.

Rather than load the graphs in batches, envisage now loads each graph individually, by firing off dozens of individual requests to the server, one for each graph. As soon as the data is returned, that graph displays.

The result is that the graphs start populating almost instantly. 

We also enhanced the system by rendering the graphs you can see as a priority and those off your screen will load once you start to scroll.

Finally, we improved how we cache the data on our systems, so the next time you load the same graphs, if they haven’t changed, they will display almost instantaneously.

Improved with Less Code

The essence of this speed improvement is efficiency. We’ve made envisage more efficient in the way it calculates data and displays it. To highlight this, some 5000 lines of code were replaced with about 2000 lines.  Less code means less bugs which is great for everyone!

What does this mean to you?

old new engine.png

The scope of this work was a huge undertaking. As an analogy, if envisage was likened to a car, we had to take out the motor, rebuild it, add a turbocharger, test thoroughly to make sure it works, then put it back in.

All while driving down the highway at high speed without stopping!

Yet, although changes like these are significant, you might not notice the difference. Why, then, would we work so hard for an apparent little gain?

Simple. We’re building the best and most robust Growth Management System™ application in the world. We’re helping to create unicorns, who track thousands of statistics everyday. And even if you’re not a unicorn yet, one day you might be. And as you grow on that journey, envisage is ready and capable to grow with you.

Know how to grow with envisage! The world’s first Growth Management System™ Application with Statistics, Org Charts, Objectives, Trends, Events and Reports. Try for free on a no-risk 14-day trial. We’ll even help you set up all your existing statistics to make sure you succeed in getting your business onto Envisage. 

Comment and ask questions below or ask questions privately.


Notes

Photo by Tim Mossholder on Unsplash

Comment

Exploring the New Trend Feature

August 5, 2020 MetaPulse Team
dashboard view trends.png

The new Trend feature provides a quick summary of all your statistics. 

You can see at a glance how your business is performing. 

The Trend summary appears on your Dashboard and can be viewed on any graph. 

Here’s how it works:

Trend Summary on the Dashboard 

dashboard view trends.png

Show & Hide Trends in Graph View

You can see all trends using the Show Trend button in Graph View. Once done, click Hide Trends.

trend gif.gif

And remember, our Trend feature includes a machine learning algorithm, so if you see a trend that’s not quite right, be sure to Flag it as shown here.

Give Trends a try today. For more information see Introduction to Trends.

Know how to grow with envisage! The world’s first Growth Management System™ Application with Statistics, Org Charts, Objectives, Trends, Events and Reports. Try for free on a no-risk 14-day trial. We’ll even help you set up all your existing statistics to make sure you succeed in getting your business onto Envisage. 

Comment and ask questions below or ask questions privately.

In New Features Tags Stats, OKRs, Analytics, Org Chart
Comment

New Features - Events & Reports

July 20, 2020 MetaPulse Team
event and report header image.png

As mentioned in our article on Growth Management, tracking major events in your business and providing a way for your team to report issues is vital to the ongoing success of your business.

In that light, we’re thrilled to announce after almost a year of developing and testing—Events and Reports are now live!

Read more
In New Features Tags Stats, Trends, Reports
Comment

Introducing the first Growth Management System™ Application

July 14, 2020 Mikel Lindsaar
Introducing the Growth Management System™.png

Every organisation at some stage faces the challenge of how to grow and scale. From a tradesman hiring their first full-time apprentice to a multinational expanding into a new country, everyone shares the same challenge:

How do you effectively manage growth?

Read more
Comment

New Website and New Features

July 7, 2020 MetaPulse Team
new features .png

You might have noticed we’ve upgraded our website!

The snazzy new look coincides with several new features we’ve rolled out (and some more we’re about to roll out).

You can still find the login page at https://envisage.io/users/sign_in.

Read more
In New Features Tags Stats, OKRs, analytics, Org Chart
Comment

Org Chart Upgrade - Hats

June 23, 2020 MetaPulse Team
Hats & Posts .png

We recently made a significant upgrade to our versatile org chart with the introductions of Hats.

Read more
In New Features Tags Org Chart, Hats
Comment

The New Trends Feature with Machine Learning

June 16, 2020 MetaPulse Team
trend feature.png

As your organization expands, monitoring every vital statistic can become cumbersome. As the number of graphs grow into the thousands, how do you keep track of everything?

We’ve solved that problem with Trends!

For almost a year we’ve been building and testing our new Trend feature. It’s a game changer for big companies who want a fast way to identify what is failing and what is working.

Here’s how it works:

Read more
In New Features Tags stats, OKRs, Analytics, Org Chart, Trends, Artificial Intelligence
Comment

Envisage Now Available in Russian (Теперь доступно на русском языке)

June 10, 2020 MetaPulse Team
envisage russian flag.png

We’re pleased to announce that envisage has been translated for all of our Russian friends (and we know there’s 150 million of you 😉).

The entire interface, menu options and features will automatically default to Russian if your browser default language is Russian.

You can also use Russian characters for your statistics, org chart and all other envisage features.

If your browser defaults to english and you only want to change Envisage to Russian, change your default language via envisage settings as shown in this help doc.

Here’s an example of envisage displayed in Russian:

russian envisage.png

If you have any questions, reach out to support. 

Наслаждаться (Enjoy!) 

And remember, envisage includes Statistics, Org Chart and OKRs and you can try for free on a no-risk 14-day trial. We’ll even help you set up all your existing statistics to make sure you succeed in getting your business onto Envisage. 

Comment and ask questions below or ask questions privately.

In Case Study, Best Practice, Book Reviews, Business Coaching, New Features, Technology Tags Stats, OKRs, analytics, Org Chart
Comment

Expanding to Multiple Locations? An Org Chart to Rule them All.

June 3, 2020 MetaPulse Team
worldwide expansion.png

When your business starts expanding globally or even country-wide, you need an org chart system to help maintain overall coordination from the top, while simultaneously allowing a local office to monitor their own team. 

Ideally the local team can operate independently, but still within the framework of the business, where top management can drill down into the details if needed. 

Is it possible to have an org chart and business intelligence system that enables both micro and macro views, without burning the satellite office with extraneous data?

Previously it was not possible. Until recently no app combined org charts and business intelligence interconnected on a global scale. 

Well, the coding geniuses behind envisage have solved that problem! 😀

Welcome to a brand new feature called Junior Org Charts. You can create unlimited linking org charts that come together in a Senior Org Chart. Everyone throughout the organisation has a place on the Senior Org Chart, but they also have their own junior organization, where they coordinate and manage their own activities. 

senior or chart - junior or chart.png

They are still part of the whole. They are still on one Org Chart. Their stats and objectives can still be monitored. 

But they also act independently, under their own management.

It’s the ultimate expansion tool.

It enables hypergrowth on a global scale and with it you can build an Org Chart that rules them all.

And remember, throughout May, we’re offering free Org Chart creation. This service is valued at $199, but will be free until the end of May 2020!

For more information register here.

Envisage includes Statistics, Org Chart and OKRs and you can try for free on a no-risk 14-day trial. We’ll even help you set up all your existing statistics to make sure you succeed in getting your business onto Envisage. 

Comment and ask questions below or ask questions privately.

In Case Study, Best Practice, Book Reviews, Business Coaching, Technology, New Features Tags Stats, OKRs, analytics, Org Chart
Comment

Warning - Hypergrowth Inevitable

May 26, 2020 MetaPulse Team
warning - hypergrowth.png

Before you jump in and start using envisage, we thought we should provide full disclosure. 

Envisage not only enables hypergrowth, it makes it inevitable. 

When you combine the power of the org chart, statistics and objectives together across your organization, the only way to go is up. 

This isn’t theory. It’s based on stats.

As our user base grows, despite worldwide turmoil, so do many of our clients. 

They’re not just surviving, they're thriving!

To build an organization, you need to organize and align your forces. Envisage lets you see what happened, when it happened, who did it and most of all, enables you to plan what will happen. 

Are you ready for hypergrowth?  It starts with your org chart and for the month of May we’re offering to build it in envisage for you, free of charge. 

This service is valued at $199. For more information register here.

And remember, envisage includes Statistics, Org Chart and OKRs and you can try free on a no risk 14-day trial. We’ll even help you set up all your existing statistics to make sure you succeed in getting your business onto Envisage. 

Comment and ask questions below or ask questions privately.

In Case Study, Best Practice, Business Coaching, Book Reviews, New Features, Technology Tags stats, OKRs, analytics, Org Chart
Comment
← Newer Posts Older Posts →
TRY envisage for 30 days
ASK US ANYTHING
No results found
 
MetaPulse RSS

chat with support.png
search the help center.png
schedule a free demo.png

Topics

Case studies
Best Practice
Business Coaching
Technology


Get free tips and insights once a week

We respect your privacy.

Thank you for joining and welcome to the team!


240px-Cc.logo.circle.svg.png
Cc-by_new.svg.png
 

© 2019 exec.io
except where otherwise noted content on this site is licensed under a Creative Commons Attribution-ShareAlike 4.0 International License.

PRIVACY POLICY | TERMS & conditions | COMMISSION DISCLOSURE