• Home
  • Blog
  • GMSC
    • Our Mission
    • Meet the Team
    • Careers
  • Bookstore
  • Contact
  • Search
  • Try MetaPulse →
Menu

MetaPulse Blog

101 California Street, Suite 2710
San Francisco, CA, 94111
+1 (415) 881-7952
Know how to grow with the world's first Growth Management System.™

Your Custom Text Here

MetaPulse Blog

  • Home
  • Blog
  • GMSC
  • About
    • Our Mission
    • Meet the Team
    • Careers
  • Bookstore
  • Contact
  • Search
  • Try MetaPulse →

Easily compare this year to last year

September 1, 2020 MetaPulse Team
Last Year Comparison Graphs -2.png

Although you should track your stats on a weekly basis, it’s often good to know if you are beating last year’s performance.

You can do this using the Offset feature, now available with Comparison Graphs and Calculated Graphs. 

We’ve made an upgrade so you can easily compare different periods in any frequency, be it weekly, monthly, quarterly or yearly. Prior to this recent upgrade, the offset feature was limited to the graph's default frequency.

Let’s create a comparison graph to compare the current month’s Sales to the Sales of the same month last year. 

Creating an Offset Comparison Graph

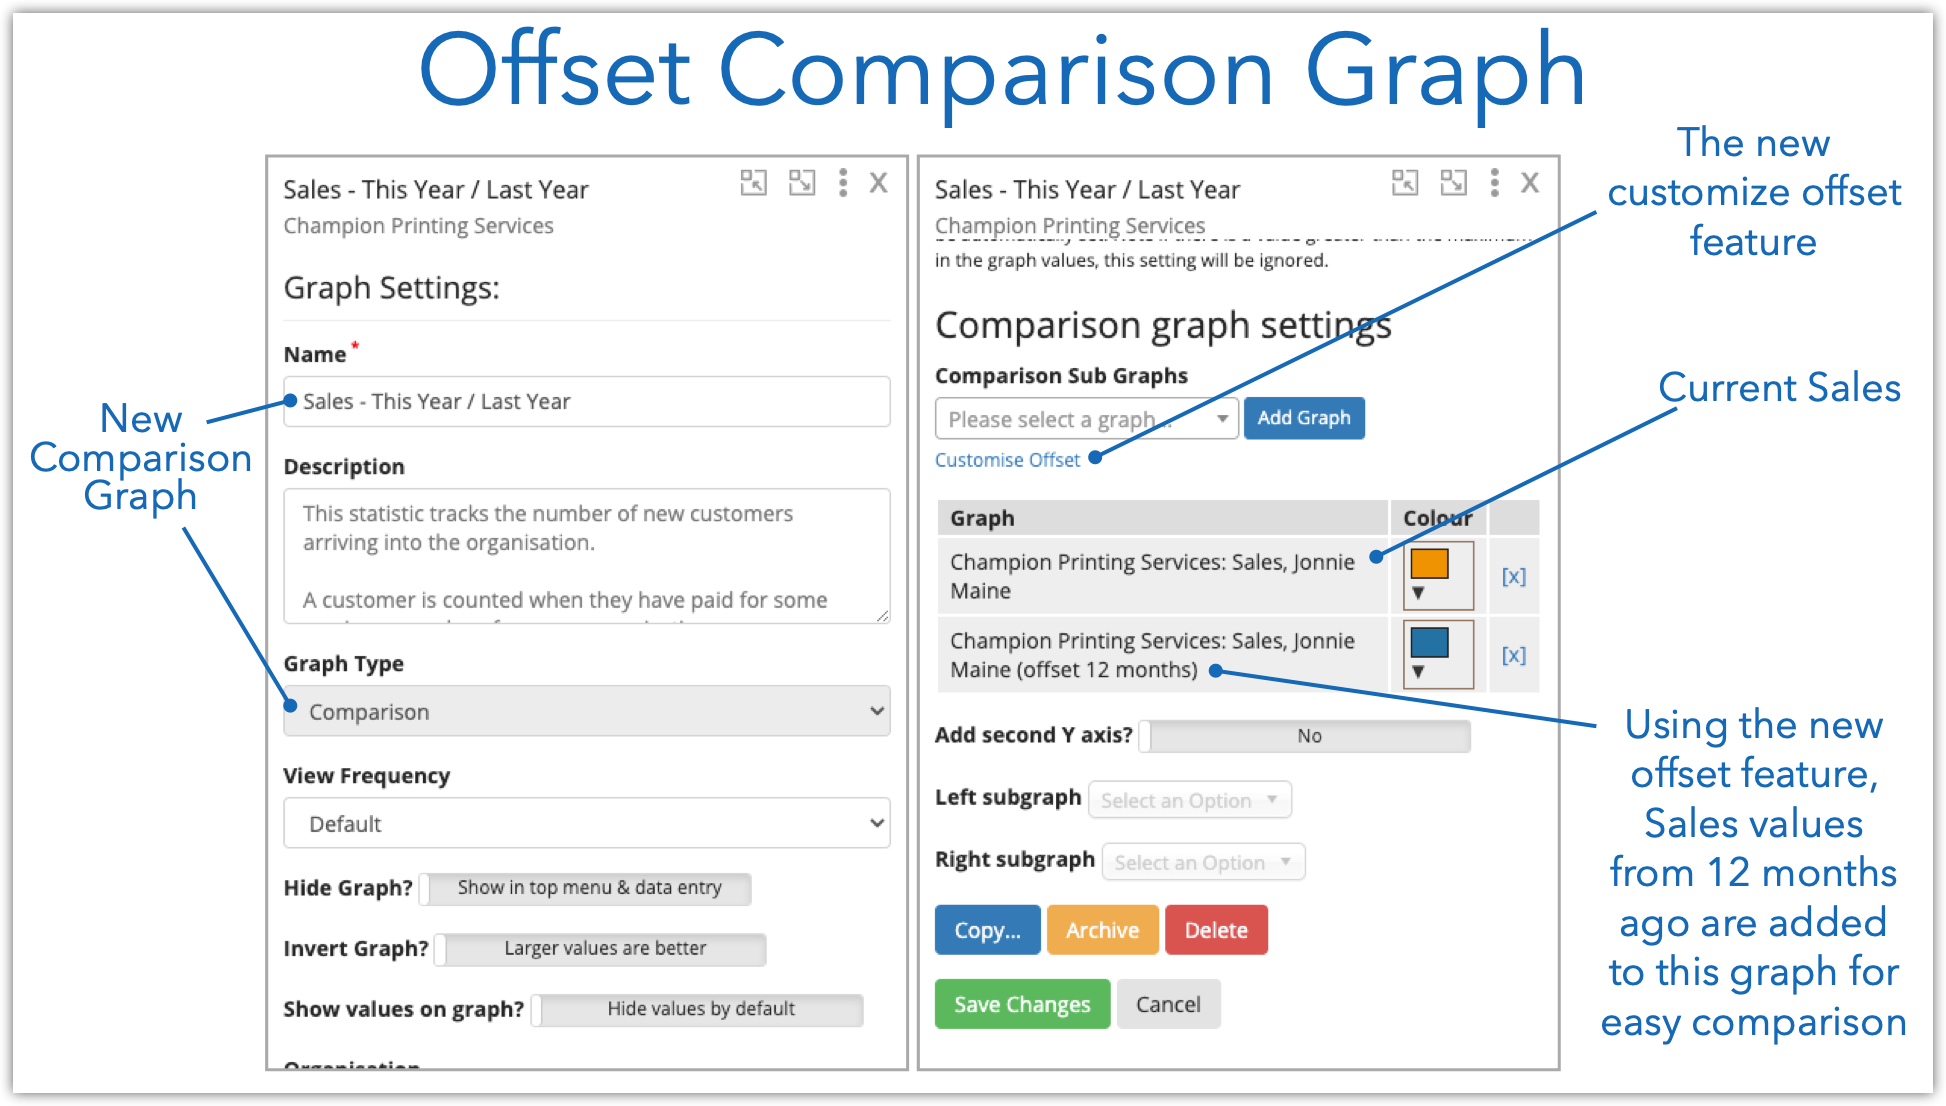
First we create a new Comparison graph called Sales This Year / Last year. Then we added the current values and 12-month-offset values as shown below.

new comparison graph-2.png

End Result

Now you can easily compare your current results to the same period last year, whether weekly, monthly or quarterly. Simple hover to see the values and dates.

Last Year Comparison Graphs -2.png

For more information on how to create a “This Year / Last Year” comparison graph see Period Offset in Calculated Graphs and How to Create a Comparison Graph. 

Know how to grow with envisage! The world’s first Growth Management System™ Application with Statistics, Org Charts, Objectives, Trends, Events and Reports. Try for free on a no-risk 14-day trial. We’ll even help you set up all your existing statistics to make sure you succeed in getting your business onto Envisage. 

Comment and ask questions below or ask questions privately.


In Case Study, Best Practice, Book Reviews, Business Coaching, New Features, Technology Tags Stats, OKRs, Analytics, Org Chart
← Org Chart - In Charge FeatureInstantly create a Current Target with a Click →
TRY envisage for 30 days
ASK US ANYTHING
 
MetaPulse RSS

chat with support.png
search the help center.png
schedule a free demo.png

Topics

Case studies
Best Practice
Business Coaching
Technology


Get free tips and insights once a week

We respect your privacy.

Thank you for joining and welcome to the team!


240px-Cc.logo.circle.svg.png
Cc-by_new.svg.png
 

© 2019 exec.io
except where otherwise noted content on this site is licensed under a Creative Commons Attribution-ShareAlike 4.0 International License.

PRIVACY POLICY | TERMS & conditions | COMMISSION DISCLOSURE