• Home
  • Blog
  • GMSC
    • Our Mission
    • Meet the Team
    • Careers
  • Bookstore
  • Contact
  • Search
  • Try MetaPulse →
Menu

MetaPulse Blog

101 California Street, Suite 2710
San Francisco, CA, 94111
+1 (415) 881-7952
Know how to grow with the world's first Growth Management System.™

Your Custom Text Here

MetaPulse Blog

  • Home
  • Blog
  • GMSC
  • About
    • Our Mission
    • Meet the Team
    • Careers
  • Bookstore
  • Contact
  • Search
  • Try MetaPulse →

Org Chart - In Charge Feature

September 4, 2020 MetaPulse Team
org chart in charge feature.png

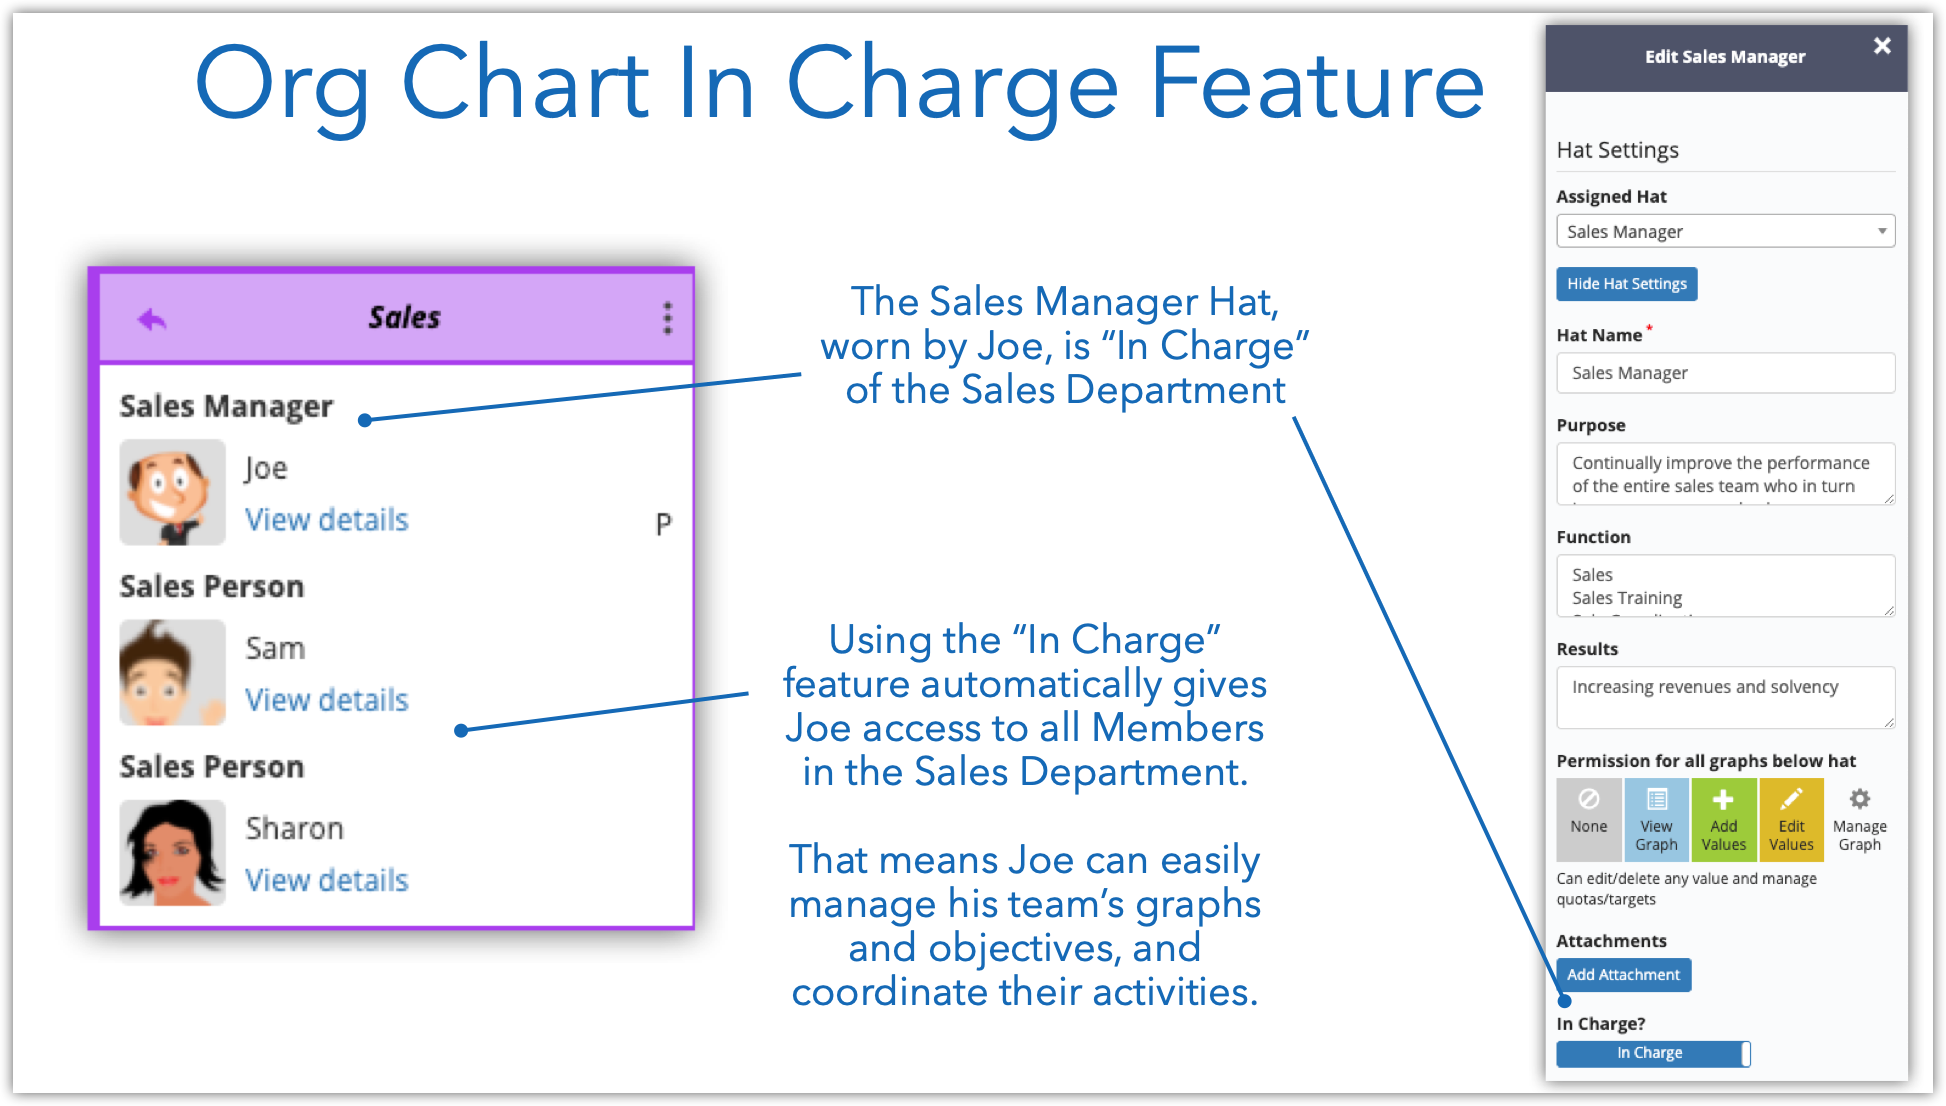
The In Charge feature in envisage makes it easy for managers to coordinate their team’s activities. 

Several weeks ago we made a significant change to the way the org chart works—we now have Hats, Posts and Members.

Each hat on the org chart can be assigned the “In Charge” of that area. This automatically grants the In Charge with edit permissions for all their juniors on the org chart. 

This makes it easy for a manager to view and update graphs, objectives and monitor their team’s performance.

This applies across the entire org chart, permitting every manager from the top to the bottom, to effectively manage.

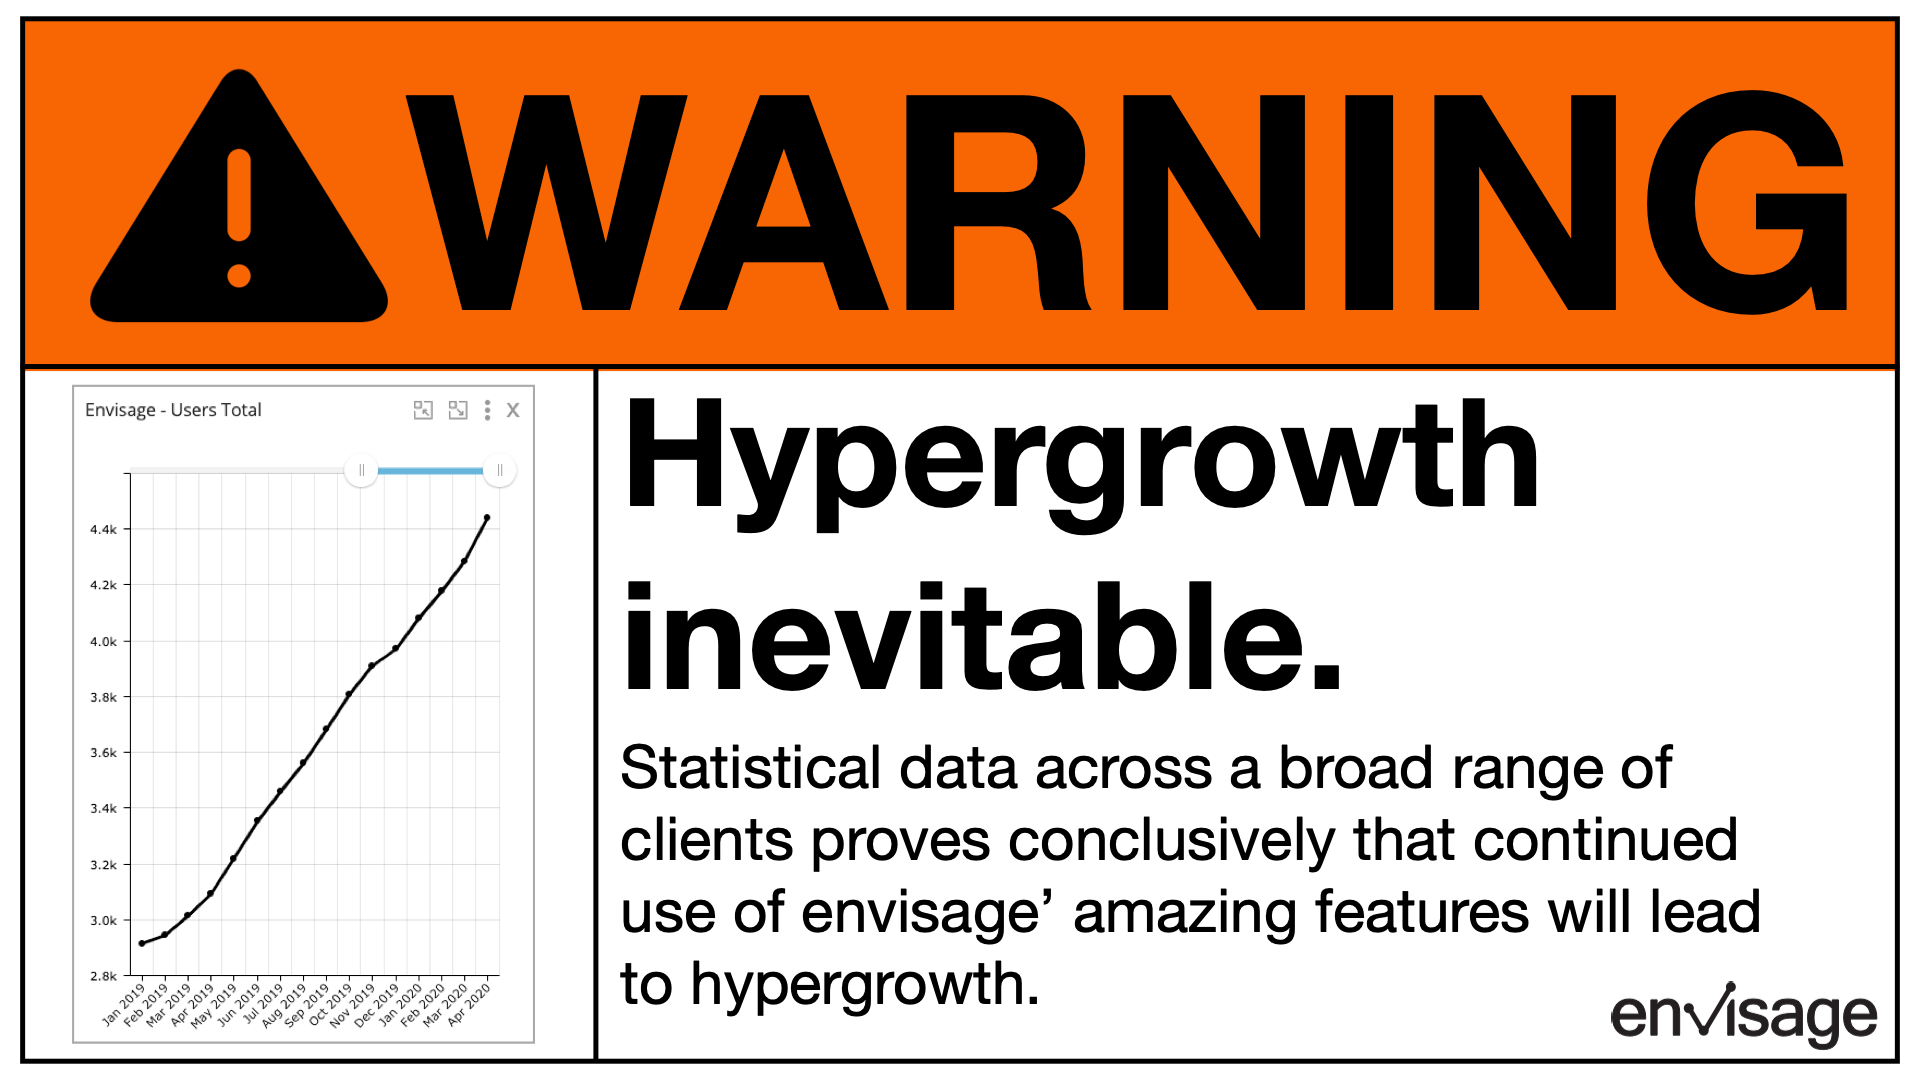
It’s another vital feature that enables hyper-growth. 

The first step is having an org chart! If you need help creating your org chart in envisage, let us know, we can help create it for you! See our help docs for more information on Creating Hats and Adding Posts to the Org Chart.

oOo

Know how to grow with envisage! The world’s first Growth Management System™ Application with Statistics, Org Charts, Objectives, Trends, Events and Reports. Try for free on a no risk 14-day trial. We’ll even help you set up all your existing statistics to make sure you succeed in getting your business onto Envisage. 

Comment and ask questions below or ask questions privately.

In Case Study, Best Practice, Book Reviews, Business Coaching, Technology, New Features Tags Stats, OKRs, Analytics, Org Chart
Comment

Easily compare this year to last year

September 1, 2020 MetaPulse Team
Last Year Comparison Graphs -2.png

Although you should track your stats on a weekly basis, it’s often good to know if you are beating last year’s performance.

You can do this using the Offset feature, now available with Comparison Graphs and Calculated Graphs. 

We’ve made an upgrade so you can easily compare different periods in any frequency, be it weekly, monthly, quarterly or yearly. Prior to this recent upgrade, the offset feature was limited to the graph's default frequency.

Let’s create a comparison graph to compare the current month’s Sales to the Sales of the same month last year. 

Creating an Offset Comparison Graph

First we create a new Comparison graph called Sales This Year / Last year. Then we added the current values and 12-month-offset values as shown below.

new comparison graph-2.png

End Result

Now you can easily compare your current results to the same period last year, whether weekly, monthly or quarterly. Simple hover to see the values and dates.

Last Year Comparison Graphs -2.png

For more information on how to create a “This Year / Last Year” comparison graph see Period Offset in Calculated Graphs and How to Create a Comparison Graph. 

Know how to grow with envisage! The world’s first Growth Management System™ Application with Statistics, Org Charts, Objectives, Trends, Events and Reports. Try for free on a no-risk 14-day trial. We’ll even help you set up all your existing statistics to make sure you succeed in getting your business onto Envisage. 

Comment and ask questions below or ask questions privately.


In Case Study, Best Practice, Book Reviews, Business Coaching, New Features, Technology Tags Stats, OKRs, Analytics, Org Chart
Comment

Exploring the New Trend Feature

August 5, 2020 MetaPulse Team
dashboard view trends.png

The new Trend feature provides a quick summary of all your statistics. 

You can see at a glance how your business is performing. 

The Trend summary appears on your Dashboard and can be viewed on any graph. 

Here’s how it works:

Trend Summary on the Dashboard 

dashboard view trends.png

Show & Hide Trends in Graph View

You can see all trends using the Show Trend button in Graph View. Once done, click Hide Trends.

trend gif.gif

And remember, our Trend feature includes a machine learning algorithm, so if you see a trend that’s not quite right, be sure to Flag it as shown here.

Give Trends a try today. For more information see Introduction to Trends.

Know how to grow with envisage! The world’s first Growth Management System™ Application with Statistics, Org Charts, Objectives, Trends, Events and Reports. Try for free on a no-risk 14-day trial. We’ll even help you set up all your existing statistics to make sure you succeed in getting your business onto Envisage. 

Comment and ask questions below or ask questions privately.

In New Features Tags Stats, OKRs, Analytics, Org Chart
Comment

New Features - Events & Reports

July 20, 2020 MetaPulse Team
event and report header image.png

As mentioned in our article on Growth Management, tracking major events in your business and providing a way for your team to report issues is vital to the ongoing success of your business.

In that light, we’re thrilled to announce after almost a year of developing and testing—Events and Reports are now live!

Read more
In New Features Tags Stats, Trends, Reports
Comment

New Website and New Features

July 7, 2020 MetaPulse Team
new features .png

You might have noticed we’ve upgraded our website!

The snazzy new look coincides with several new features we’ve rolled out (and some more we’re about to roll out).

You can still find the login page at https://envisage.io/users/sign_in.

Read more
In New Features Tags Stats, OKRs, analytics, Org Chart
Comment

Org Chart Upgrade - Hats

June 23, 2020 MetaPulse Team
Hats & Posts .png

We recently made a significant upgrade to our versatile org chart with the introductions of Hats.

Read more
In New Features Tags Org Chart, Hats
Comment

The New Trends Feature with Machine Learning

June 16, 2020 MetaPulse Team
trend feature.png

As your organization expands, monitoring every vital statistic can become cumbersome. As the number of graphs grow into the thousands, how do you keep track of everything?

We’ve solved that problem with Trends!

For almost a year we’ve been building and testing our new Trend feature. It’s a game changer for big companies who want a fast way to identify what is failing and what is working.

Here’s how it works:

Read more
In New Features Tags stats, OKRs, Analytics, Org Chart, Trends, Artificial Intelligence
Comment

Envisage Now Available in Russian (Теперь доступно на русском языке)

June 10, 2020 MetaPulse Team
envisage russian flag.png

We’re pleased to announce that envisage has been translated for all of our Russian friends (and we know there’s 150 million of you 😉).

The entire interface, menu options and features will automatically default to Russian if your browser default language is Russian.

You can also use Russian characters for your statistics, org chart and all other envisage features.

If your browser defaults to english and you only want to change Envisage to Russian, change your default language via envisage settings as shown in this help doc.

Here’s an example of envisage displayed in Russian:

russian envisage.png

If you have any questions, reach out to support. 

Наслаждаться (Enjoy!) 

And remember, envisage includes Statistics, Org Chart and OKRs and you can try for free on a no-risk 14-day trial. We’ll even help you set up all your existing statistics to make sure you succeed in getting your business onto Envisage. 

Comment and ask questions below or ask questions privately.

In Case Study, Best Practice, Book Reviews, Business Coaching, New Features, Technology Tags Stats, OKRs, analytics, Org Chart
Comment

Expanding to Multiple Locations? An Org Chart to Rule them All.

June 3, 2020 MetaPulse Team
worldwide expansion.png

When your business starts expanding globally or even country-wide, you need an org chart system to help maintain overall coordination from the top, while simultaneously allowing a local office to monitor their own team. 

Ideally the local team can operate independently, but still within the framework of the business, where top management can drill down into the details if needed. 

Is it possible to have an org chart and business intelligence system that enables both micro and macro views, without burning the satellite office with extraneous data?

Previously it was not possible. Until recently no app combined org charts and business intelligence interconnected on a global scale. 

Well, the coding geniuses behind envisage have solved that problem! 😀

Welcome to a brand new feature called Junior Org Charts. You can create unlimited linking org charts that come together in a Senior Org Chart. Everyone throughout the organisation has a place on the Senior Org Chart, but they also have their own junior organization, where they coordinate and manage their own activities. 

senior or chart - junior or chart.png

They are still part of the whole. They are still on one Org Chart. Their stats and objectives can still be monitored. 

But they also act independently, under their own management.

It’s the ultimate expansion tool.

It enables hypergrowth on a global scale and with it you can build an Org Chart that rules them all.

And remember, throughout May, we’re offering free Org Chart creation. This service is valued at $199, but will be free until the end of May 2020!

For more information register here.

Envisage includes Statistics, Org Chart and OKRs and you can try for free on a no-risk 14-day trial. We’ll even help you set up all your existing statistics to make sure you succeed in getting your business onto Envisage. 

Comment and ask questions below or ask questions privately.

In Case Study, Best Practice, Book Reviews, Business Coaching, Technology, New Features Tags Stats, OKRs, analytics, Org Chart
Comment

Warning - Hypergrowth Inevitable

May 26, 2020 MetaPulse Team
warning - hypergrowth.png

Before you jump in and start using envisage, we thought we should provide full disclosure. 

Envisage not only enables hypergrowth, it makes it inevitable. 

When you combine the power of the org chart, statistics and objectives together across your organization, the only way to go is up. 

This isn’t theory. It’s based on stats.

As our user base grows, despite worldwide turmoil, so do many of our clients. 

They’re not just surviving, they're thriving!

To build an organization, you need to organize and align your forces. Envisage lets you see what happened, when it happened, who did it and most of all, enables you to plan what will happen. 

Are you ready for hypergrowth?  It starts with your org chart and for the month of May we’re offering to build it in envisage for you, free of charge. 

This service is valued at $199. For more information register here.

And remember, envisage includes Statistics, Org Chart and OKRs and you can try free on a no risk 14-day trial. We’ll even help you set up all your existing statistics to make sure you succeed in getting your business onto Envisage. 

Comment and ask questions below or ask questions privately.

In Case Study, Best Practice, Business Coaching, Book Reviews, New Features, Technology Tags stats, OKRs, analytics, Org Chart
Comment

Easily Import Your Entire Team into Envisage

May 12, 2020 MetaPulse Team
everyone inside envisage.png

With envisage you get unlimited users! That’s right, for only $20 per month your entire team can use envisage.

And now, with our new Member Import feature, we’ve made adding your entire team even easier!

This feature can also be used to mass update any field, including contact phone numbers, status, Employ IDs, and more. 

See our help docs for more information here.

And remember, throughout May, we’re offering free Org Chart creation. This service is valued at $199, but will be free until the end of May 2020!

For more information register here.

And remember envisage includes Statistics, Org Chart and OKRs and you can try for free on a no-risk 14-day trial. We’ll even help you set up all your existing statistics to make sure you succeed in getting your business onto Envisage. 

Comment and ask questions below or ask questions privately.

In New Features Tags Stats, Org Chart
Comment

Easily Create Ratio Graphs

April 15, 2020 MetaPulse Team
champion stats header image.png

How many phone calls does it take to get a qualified lead?

How many leads does it take to make a sale?

And what about the ratio of appointments to sales?

If you are already tracking calls, leads, appointments and sales, you can easily find out how well the entire team is doing, as well as each individual. 

Let me show you how it’s done.

Our fictitious business, Champion Printing, tracks the following stats:

champion stats 1.png

Now let’s work out the ratio between Quotes and Sales using the Calculated Graph feature.

champion stats 2.png

We can also apply this method to each individual to see how well they are performing in comparison to the current team conversion rate of 63%!

champion stats 3.png

It’s obvious that Sam is the weak link in the sales process. Perhaps he needs more training, or there are other factors affecting his performance. Regardless, we know we need to investigate and see how we can help Sam improve.

Want to know more? Check out the Calculated Graph feature and reach out to support if you need help. 

And remember envisage includes Statistics, Org Chart and OKRs and you can try it for free on a no-risk 14-day trial. We’ll even help you set up all your existing statistics to make sure you succeed in getting your business onto Envisage. 

Comment and ask questions below or ask questions privately.

In Case Study, Best Practice, Book Reviews, Business Coaching, New Features, Technology Tags Stats, OKRs, Analytics, Org Chart
Comment

New Feature Release - Email Notifications Are Here!

March 30, 2020 MetaPulse Team
email reminder - header image.png

There’s never been a better time to add your whole team to envisage!

Now with Email Notifications, we’ll follow up your team automatically and remind them to enter their stats.

You can check out the Email Notifications Tour to see how it works. (Note this tour is only available to account holders and requires you to login to your envisage account.)

Read more
In New Features Tags Email Notifications, Stats
Comment

Live Status - Behind the Scenes Look

March 19, 2020 MetaPulse Team
live status - behind the scenes 1.png

The idea of building an online app appeals to many as a wonderful business. Just throw up a website and start earning monthly revenue. Easy peasy!

Well, like all things, if you truly want to build something worthwhile, it takes time, money and commitment.

Envisage is more than just a “stats app”—with org charts, objectives, trends and reports. It was built from the ground up to help our users enable, foster and manage hypergrowth for their companies. There is a massive amount of data stored in the background, with millions of calculations required to bring that data to you in the form of a graph or chart. This data is stored in databases that are regularly backed up. Also, these databases need to be maintained. 

Much of this happens in the background and as a user, everything appears seamless. Occasionally, however, something breaks. It might be a server, internet connections, operating system limitations or a host of other things that would require me to spew out acronyms like alphabet soup that would serve no purpose other than to confuse you. 

The point is that when you have an app like envisage which hundreds of companies use to manage and grow their business, we have a responsibility to ensure that your data is safe and accessible—in short, we need to ensure the app works.

On Friday 13th March, around 5pm EST, we had a database issue that caused envisage to timeout. While not everyone was affected, we took major action. The development team worked 9 hours straight to figure out the problem and resolved it permanently. The problem was, in simple terms, we’d hit a limitation with the version of software we use to manage the databases. It’s one of those things you’d never know existed until you run head on into it. The team not only upgraded the software, but also upgraded the servers.

We’ve also instigated a Status page, so you can easily see what is happening in the background and for any future issues, you’ll be able to track realtime what the team are doing to fix it. All information about any issue remains on our status page for your future reference and peace of mind on how we identified and solved the issue. This aligns with our policy of being completely transparent with you, our users.

image.jpg

As a result of the recent issue, envisage now runs even faster on an even more robust system!

via GIPHY

And if you didn’t notice anything, wonderful—that’s how it's meant to be!

P.S. You can see our status page at status.envisage.io or via the in-app chat.

live status - behind the scenes 3.png

And remember envisage includes Statistics, Org Charts and OKRs and you can try it for free on a no-risk 14-day trial. We’ll even help you set up all your existing statistics to make sure you succeed in getting your business onto Envisage and on its way to hyper-growth!

Comment and ask questions below or ask questions privately.

In Case Study, Best Practice, Book Reviews, Business Coaching, Technology, New Features Tags Stats, OKRs, Analytics, Org Chart
Comment

Data Entry Now Has Autosave

March 2, 2020 MetaPulse Team

We’ve made Data Entry even easier with Autosave.

All you have to do is enter the value. As soon as you hit Enter or Tab to the next row, envisage will automatically save your data.

Read more
In New Features Tags stats
Comment

New Features for 2020

January 29, 2020 Mikel Lindsaar
header.jpg

We’ve got a lot of new features currently in development and we thought you’d like to know what we plan to release in 2020.

  1. Events Log

  2. Email Notifications

  3. Trend Recognition

  4. Org Chart Templates

  5. Reports

  6. Data Sources

  7. Policy

Read more
In New Features
Comment

Objectives Released and New Pricing Coming 2020

December 11, 2019 Mikel Lindsaar
new feature new pricing 2020.png

We’re excited to let you know that we have released our new Objectives and Key Results feature!

In development for 12 months and thoroughly tested by our largest clients, this provides you with a way to set and meet real objectives in your organisation, all backed by actual statistics.

We are pretty excited about this!

We’re also adopting a new pricing model starting 2020. It will only apply to new clients, so this month is your last chance to lock in the current rates. 

For our current clients … as a reward for your loyalty and support during our fledgling years, we’re going to keep you on the current pricing—your part of our legacy, so the Legacy Pricing applies to you. (You’re welcome😉) 

Read more
In New Features
Comment

Org Chart design made even easier with these two new features

November 26, 2019 MetaPulse Team
floating org nodes.png

Org Charts come in all shapes and sizes. 

And to make it easier to design your ideal Org Chart, we’ve added two highly requested features.

  1. Floating Org Nodes

  2. Easily Rearrange Child Nodes  

Let me show you how they work…

Read more
In New Features, Technology Tags Org Chart
Comment
← Newer Posts
TRY envisage for 30 days
ASK US ANYTHING
 
MetaPulse RSS

chat with support.png
search the help center.png
schedule a free demo.png

Topics

Case studies
Best Practice
Business Coaching
Technology


Get free tips and insights once a week

We respect your privacy.

Thank you for joining and welcome to the team!


240px-Cc.logo.circle.svg.png
Cc-by_new.svg.png
 

© 2019 exec.io
except where otherwise noted content on this site is licensed under a Creative Commons Attribution-ShareAlike 4.0 International License.

PRIVACY POLICY | TERMS & conditions | COMMISSION DISCLOSURE