• Home
  • Blog
  • GMSC
    • Our Mission
    • Meet the Team
    • Careers
  • Bookstore
  • Contact
  • Search
  • Try MetaPulse →
Menu

MetaPulse Blog

101 California Street, Suite 2710
San Francisco, CA, 94111
+1 (415) 881-7952
Know how to grow with the world's first Growth Management System.™

Your Custom Text Here

MetaPulse Blog

  • Home
  • Blog
  • GMSC
  • About
    • Our Mission
    • Meet the Team
    • Careers
  • Bookstore
  • Contact
  • Search
  • Try MetaPulse →

Easily Import Your Entire Team into Envisage

May 12, 2020 MetaPulse Team
everyone inside envisage.png

With envisage you get unlimited users! That’s right, for only $20 per month your entire team can use envisage.

And now, with our new Member Import feature, we’ve made adding your entire team even easier!

This feature can also be used to mass update any field, including contact phone numbers, status, Employ IDs, and more. 

See our help docs for more information here.

And remember, throughout May, we’re offering free Org Chart creation. This service is valued at $199, but will be free until the end of May 2020!

For more information register here.

And remember envisage includes Statistics, Org Chart and OKRs and you can try for free on a no-risk 14-day trial. We’ll even help you set up all your existing statistics to make sure you succeed in getting your business onto Envisage. 

Comment and ask questions below or ask questions privately.

In New Features Tags Stats, Org Chart
Comment

VIDEO: Basic Org Chart Structure in under 2 minutes!

May 5, 2020 MetaPulse Team

Watch the video above to see how easy it is to create your org chart!

And to make it even easier we can create it for you!

Send us your org chart and we’ll build it in envisage. 

This service is valued at $199, but will be free until the end of May 2020!

For more information register here.

And remember envisage includes Statistics, the Org Chart and OKRs and you can try for free on a no-risk 14-day trial. We’ll even help you set up all your existing statistics to make sure you succeed in getting your business onto Envisage. 

Comment and ask questions below or ask questions privately.

In Case Study, Technology Tags Org Chart
Comment

Free Org Chart Creation!

April 28, 2020 MetaPulse Team
org chart features.png

We get it … you’d love to create an org chart in envisage, but you don’t have the time to set it up.

Yet you know that creating an organising chart for your business would be beneficial in helping you expand, especially in envisage, as you can link it up to all of your statistics.

Well, we have a solution for you. 😃

How about we create your envisage org chart for you? 

All you need to do is send us a copy of your existing org chart as a PDF, word doc or excel file and we’ll re-create your org chart in envisage, free of charge.  

This service is valued at $199, but will be free until the end of May!

So don’t delay, send us your org chart now and we’ll create it for you in envisage.

Complete the form below to register. Note: This offer is only available to paid accounts.


Complete the form below and upload your file.

Name *
Thank you!
 

And remember, envisage includes Statistics, Org Chart and OKRs and you can try for free on a no-risk 14-day trial. We’ll even help you set up all your existing statistics to make sure you succeed in getting your business onto Envisage. 

Comment and ask questions below or ask questions privately.

Comment

Easily Create Ratio Graphs

April 15, 2020 MetaPulse Team
champion stats header image.png

How many phone calls does it take to get a qualified lead?

How many leads does it take to make a sale?

And what about the ratio of appointments to sales?

If you are already tracking calls, leads, appointments and sales, you can easily find out how well the entire team is doing, as well as each individual. 

Let me show you how it’s done.

Our fictitious business, Champion Printing, tracks the following stats:

champion stats 1.png

Now let’s work out the ratio between Quotes and Sales using the Calculated Graph feature.

champion stats 2.png

We can also apply this method to each individual to see how well they are performing in comparison to the current team conversion rate of 63%!

champion stats 3.png

It’s obvious that Sam is the weak link in the sales process. Perhaps he needs more training, or there are other factors affecting his performance. Regardless, we know we need to investigate and see how we can help Sam improve.

Want to know more? Check out the Calculated Graph feature and reach out to support if you need help. 

And remember envisage includes Statistics, Org Chart and OKRs and you can try it for free on a no-risk 14-day trial. We’ll even help you set up all your existing statistics to make sure you succeed in getting your business onto Envisage. 

Comment and ask questions below or ask questions privately.

In Case Study, Best Practice, Book Reviews, Business Coaching, New Features, Technology Tags Stats, OKRs, Analytics, Org Chart
Comment

Managing Remote Staff with Envisage

April 7, 2020 MetaPulse Team
remote office-2.png

Is your team working from home?

How do you know if the job is still getting done?

How can you see their production?

It’s easy with envisage. Here’s how you do it:

  1. Give everyone on your team at least one statistic that tracks their results - e.g. number of tasks completed, phone calls made, emails answered.

  2. Get everyone to enter their statistic daily, at the end of the working day or first thing the next day.

org chart search results.png

The benefits:

  1. As the manager or owner, you’ll be able to see how your team is doing.

  2. Everyone will still feel part of a productive team getting things done.

  3. You’ll be able to spot lagging statistics early and help that person or area get their production into the desired range.

We have clients with over 800 staff who have shifted to remote work and because they use envisage, they are able to operate just like they were in the office. Why not give it a try?

And remember envisage includes Statistics, Org Chart and OKRs and you can try for free on a no-risk 14-day trial. We’ll even help you set up all your existing statistics to make sure you succeed in getting your business onto Envisage. 

Comment and ask questions below or ask questions privately.

In Best Practice Tags stats
Comment

New Feature Release - Email Notifications Are Here!

March 30, 2020 MetaPulse Team
email reminder - header image.png

There’s never been a better time to add your whole team to envisage!

Now with Email Notifications, we’ll follow up your team automatically and remind them to enter their stats.

You can check out the Email Notifications Tour to see how it works. (Note this tour is only available to account holders and requires you to login to your envisage account.)

Read more
In New Features Tags Email Notifications, Stats
Comment

Live Status - Behind the Scenes Look

March 19, 2020 MetaPulse Team
live status - behind the scenes 1.png

The idea of building an online app appeals to many as a wonderful business. Just throw up a website and start earning monthly revenue. Easy peasy!

Well, like all things, if you truly want to build something worthwhile, it takes time, money and commitment.

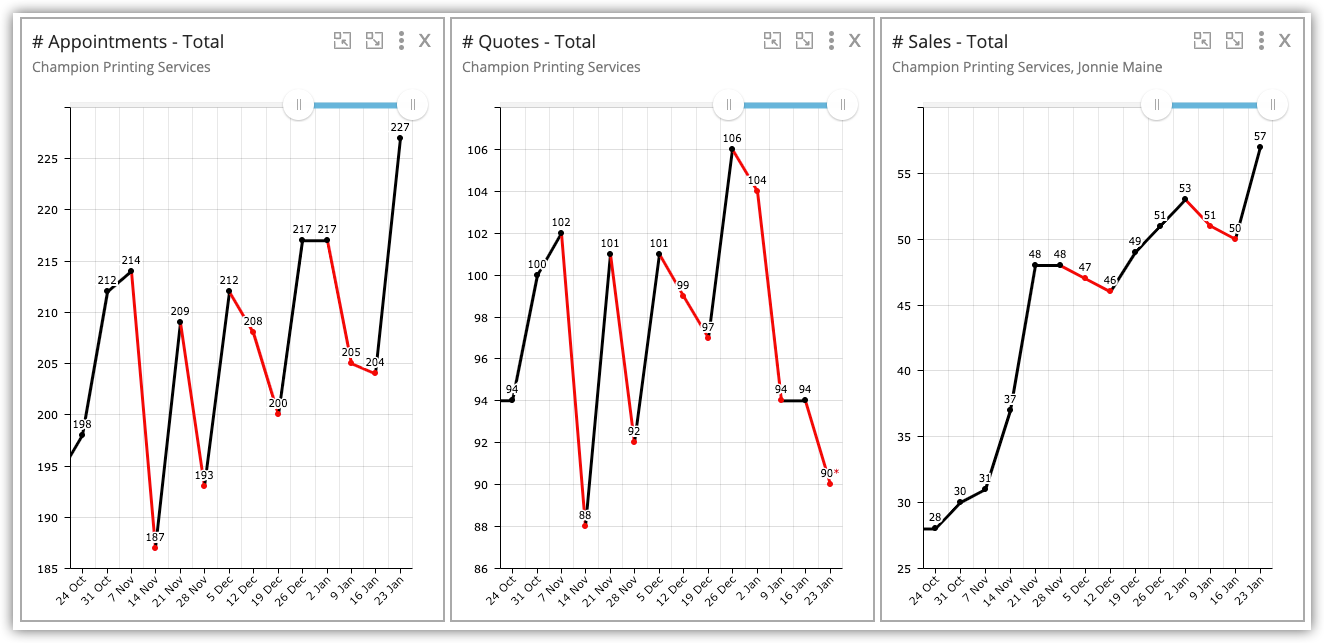
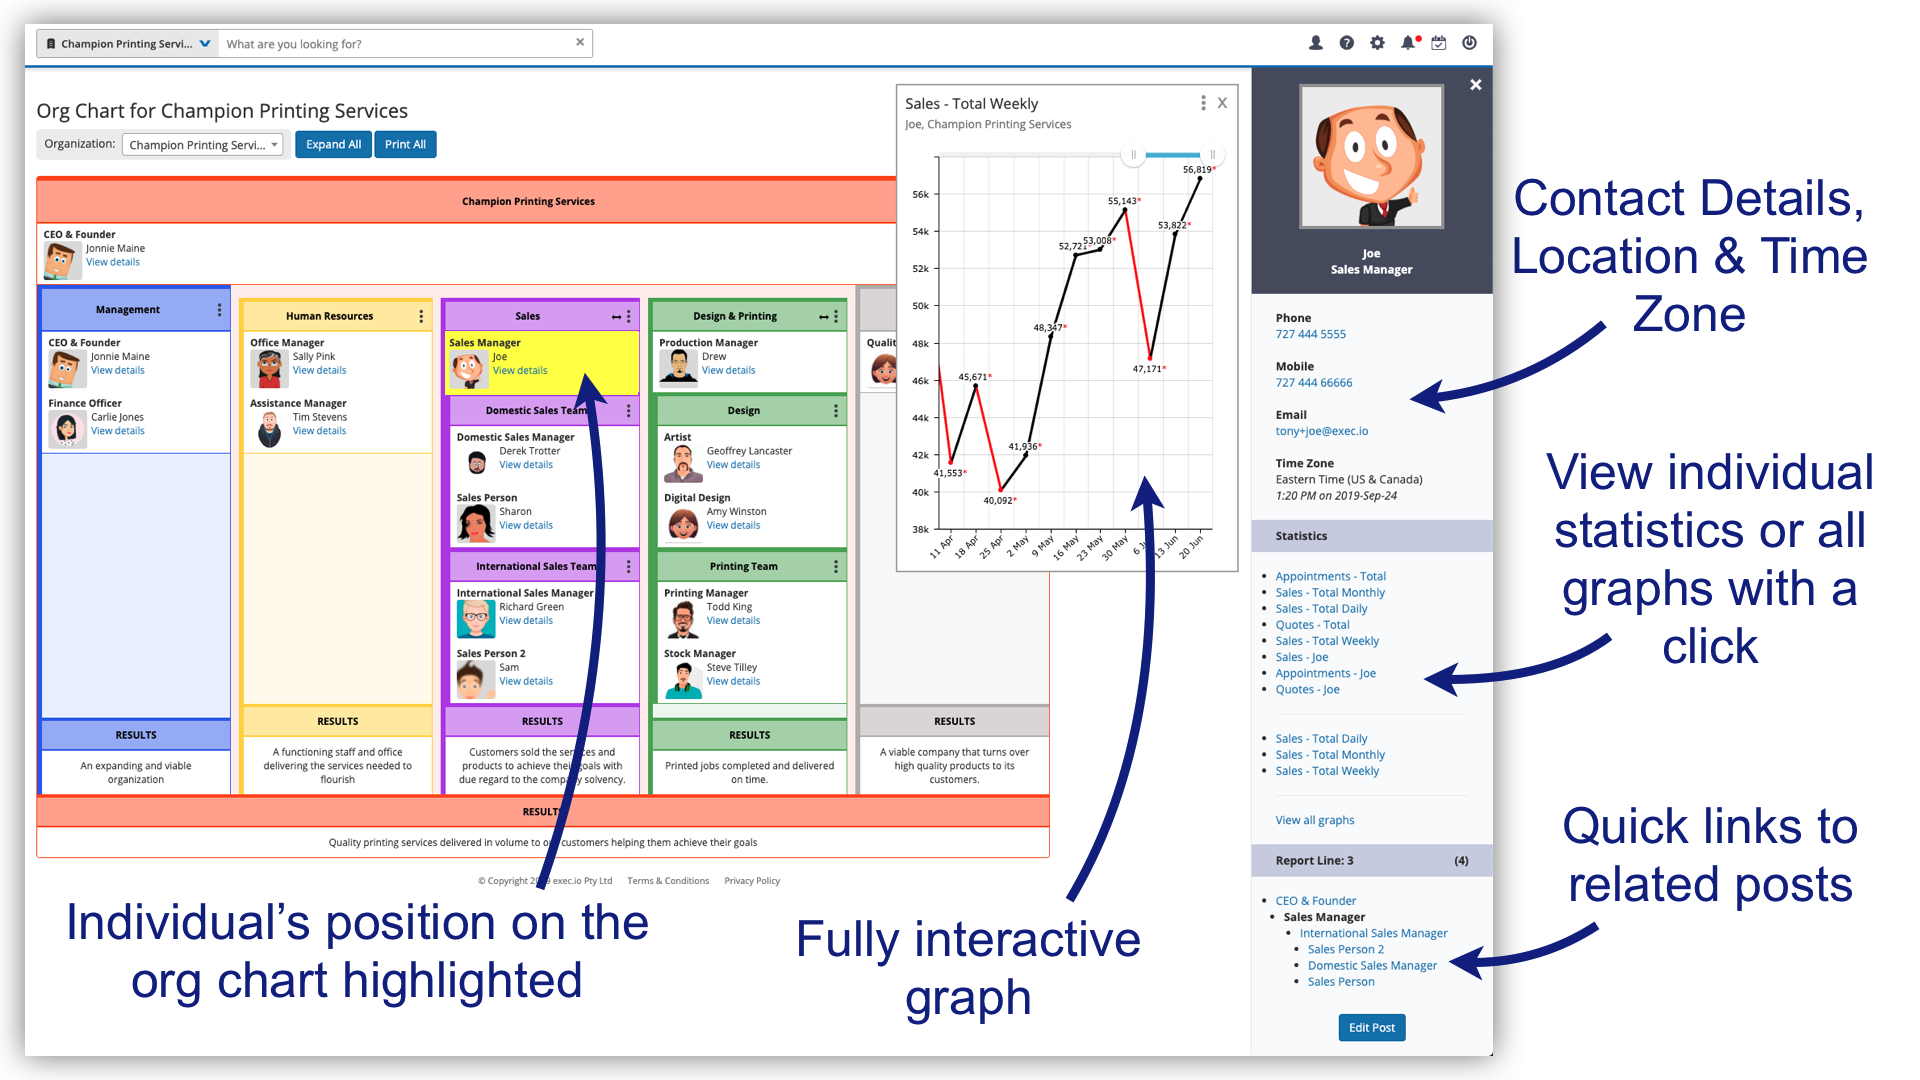
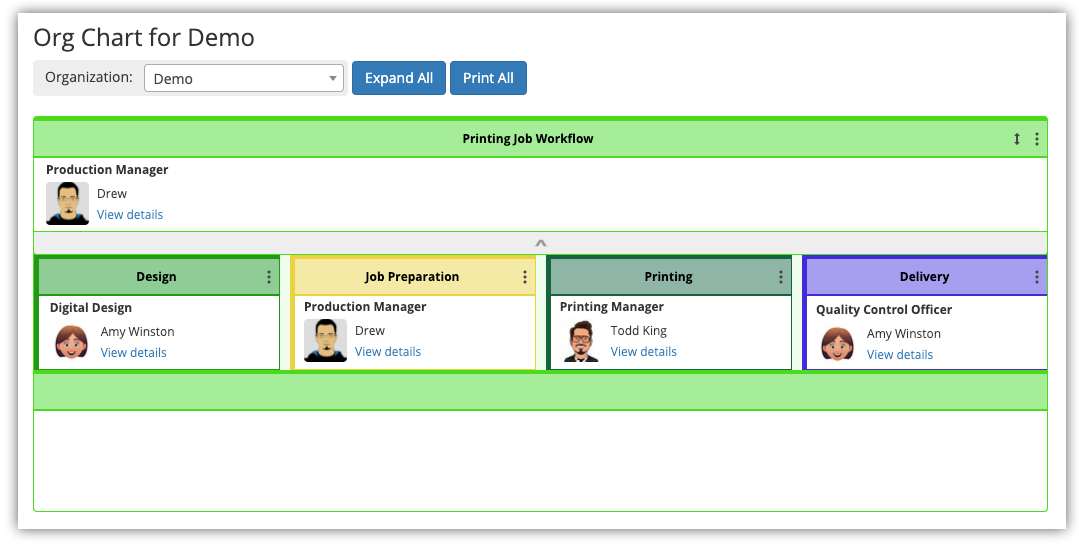
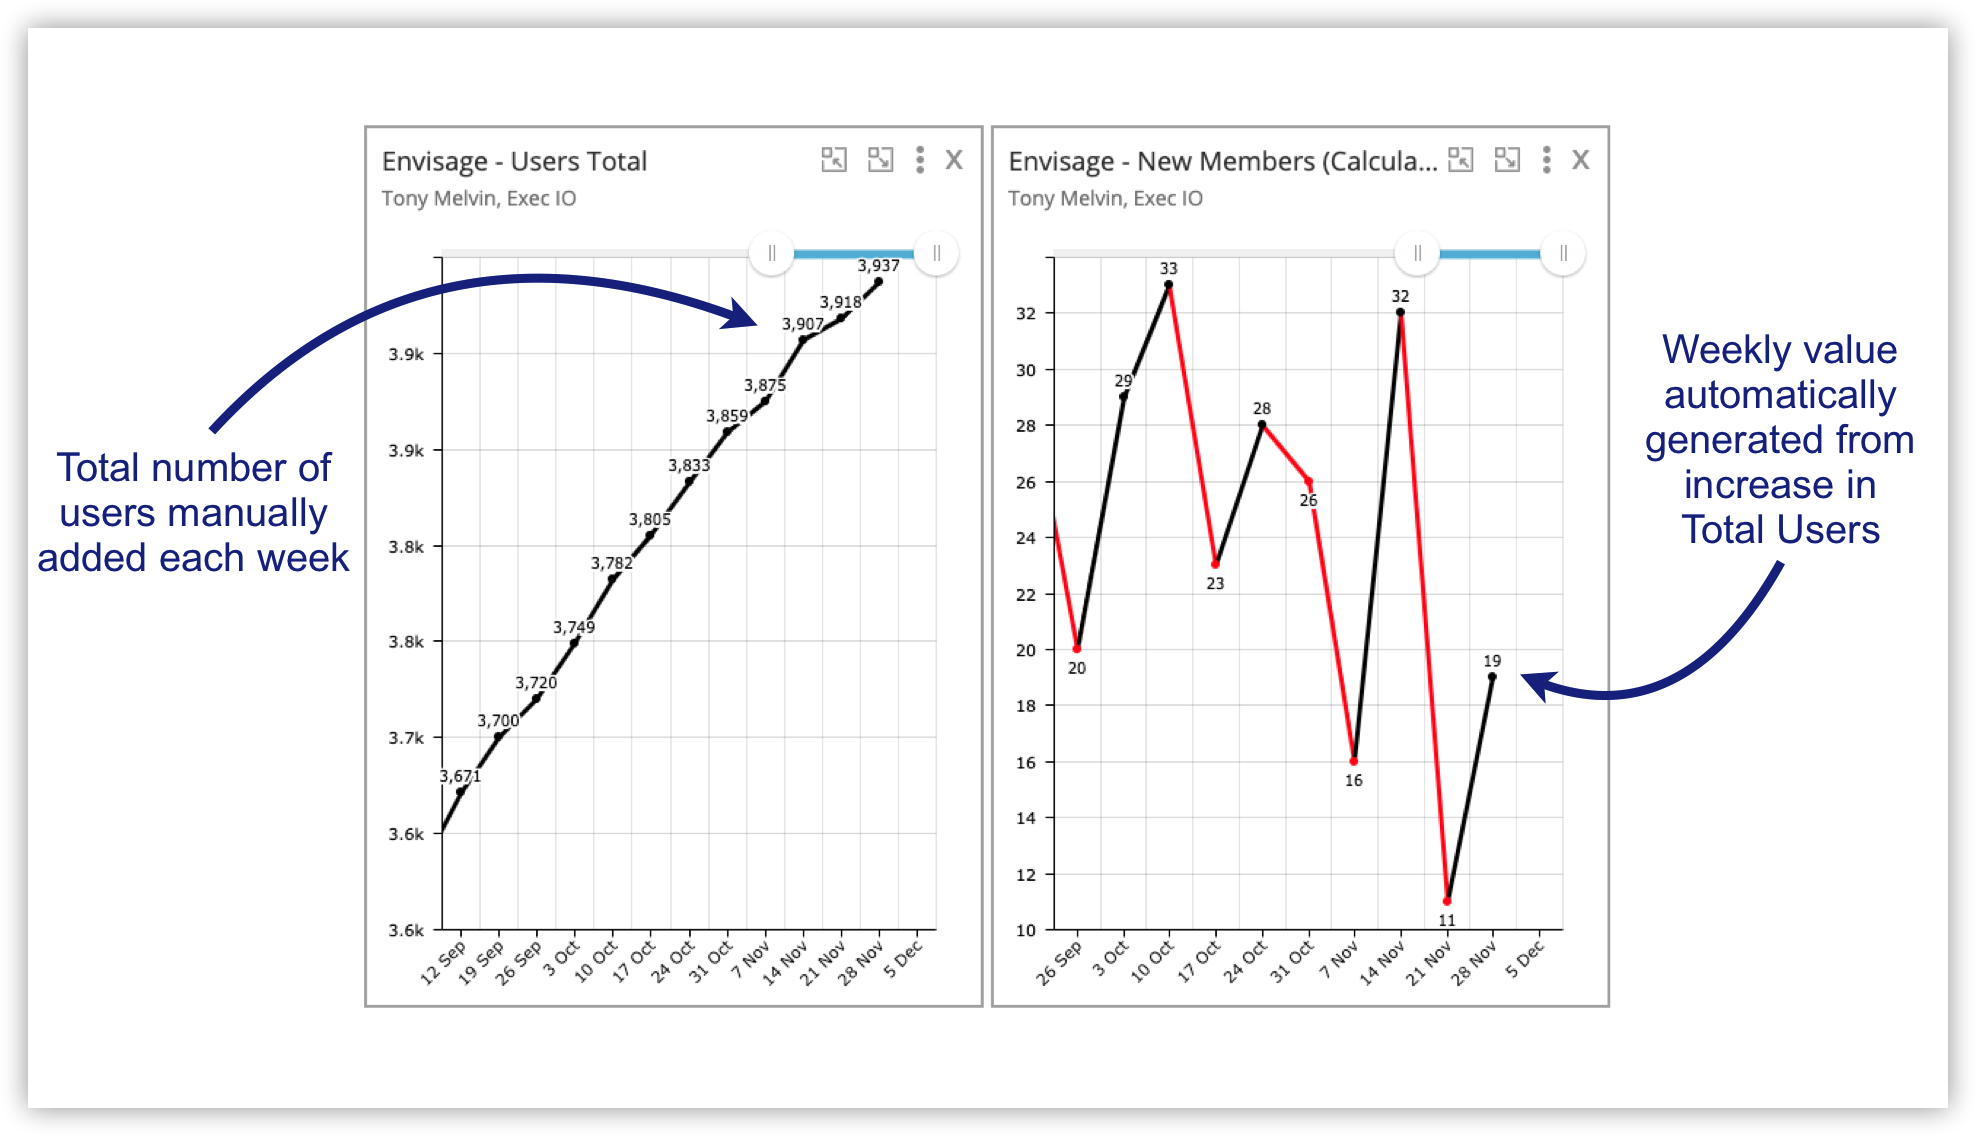
Envisage is more than just a “stats app”—with org charts, objectives, trends and reports. It was built from the ground up to help our users enable, foster and manage hypergrowth for their companies. There is a massive amount of data stored in the background, with millions of calculations required to bring that data to you in the form of a graph or chart. This data is stored in databases that are regularly backed up. Also, these databases need to be maintained. 

Much of this happens in the background and as a user, everything appears seamless. Occasionally, however, something breaks. It might be a server, internet connections, operating system limitations or a host of other things that would require me to spew out acronyms like alphabet soup that would serve no purpose other than to confuse you. 

The point is that when you have an app like envisage which hundreds of companies use to manage and grow their business, we have a responsibility to ensure that your data is safe and accessible—in short, we need to ensure the app works.

On Friday 13th March, around 5pm EST, we had a database issue that caused envisage to timeout. While not everyone was affected, we took major action. The development team worked 9 hours straight to figure out the problem and resolved it permanently. The problem was, in simple terms, we’d hit a limitation with the version of software we use to manage the databases. It’s one of those things you’d never know existed until you run head on into it. The team not only upgraded the software, but also upgraded the servers.

We’ve also instigated a Status page, so you can easily see what is happening in the background and for any future issues, you’ll be able to track realtime what the team are doing to fix it. All information about any issue remains on our status page for your future reference and peace of mind on how we identified and solved the issue. This aligns with our policy of being completely transparent with you, our users.

image.jpg

As a result of the recent issue, envisage now runs even faster on an even more robust system!

via GIPHY

And if you didn’t notice anything, wonderful—that’s how it's meant to be!

P.S. You can see our status page at status.envisage.io or via the in-app chat.

live status - behind the scenes 3.png

And remember envisage includes Statistics, Org Charts and OKRs and you can try it for free on a no-risk 14-day trial. We’ll even help you set up all your existing statistics to make sure you succeed in getting your business onto Envisage and on its way to hyper-growth!

Comment and ask questions below or ask questions privately.

In Case Study, Best Practice, Book Reviews, Business Coaching, Technology, New Features Tags Stats, OKRs, Analytics, Org Chart
Comment

Measure the past. Create the future.

March 17, 2020 MetaPulse Team
stats-objective past and future.png

Using statistics allows you to see what has happened and what is currently happening in your business.

Objectives are a tool you use to decide what will happen in the future.

Combined they give you unprecedented control over your company, your income and your goals.

Let’s take a look at how this works:

Imagine you want to 10x your sales over the next 12 months.

What will that take?

Let’s say, your current sales are $1 million per year and you want to get to $10M.

To achieve this objective, you’ll need to:

  1. 10x your promotion and marketing

  2. 10x your sales team (recruit more sales people)

  3. Increase your sales training

  4. Increase your delivery capabilities.

Now you use envisage to set these objectives.

image.jpg

As the weeks go by, you can see at a glance the progress your team is making toward this major objective of 10X Sales. 

More importantly, you can instantly drill down into the detail to see what is happening at ground level. You can find out, within a few clicks, who on your team is having difficulty keeping up with the target.

With the information at your fingertips, you can take action and fix the situation, whether it’s recruit more people, train or replace existing people or improve the resources. Working in this fashion, by using stats and objectives and having everyone on your team working towards the same objective, you will get there.

If you can envisage it, then it can be done!

Start using objectives today. See the help docs for how to get started. 

And remember envisage includes Statistics, Org Charts and OKRs and you can try it for free on a no-risk 14-day trial. We’ll even help you set up all your existing statistics to make sure you succeed in getting your business onto Envisage. 

Comment and ask questions below or ask questions privately.

In Best Practice Tags Stats, OKRs, analytics
Comment

Data Entry Now Has Autosave

March 2, 2020 MetaPulse Team

We’ve made Data Entry even easier with Autosave.

All you have to do is enter the value. As soon as you hit Enter or Tab to the next row, envisage will automatically save your data.

Read more
In New Features Tags stats
Comment

Use the Org Chart Feature to Map Workflows

February 20, 2020 MetaPulse Team
Map Workflow Blog header.png

You don’t need to create an entire org chart before you benefit from the Org Chart feature, instead you can start with a simple workflow. 

Let’s use Champion Printing as an example.

They have a basic workflow for all printing jobs, like so:

  1. Design

  2. Job Preparation

  3. Printing

  4. Delivery

Let’s say a different person is responsible for each role.

You can easily create this workflow using the Org Chart feature in envisage. Here’s what it looks like: 

org chart workflow .png

With this basic workflow created, let’s add the people.

org chart workflow - post names.png

Now we can assign a statistic to each individual that measures the results of each step of this workflow. 

This simple application of these powerful envisage features will help create a coordinated team and improve the results of this small, yet important section of the organisation. 

You can view this vertically as well:

org chart workflow - vertical.png

Go ahead and create a simple workflow in envisage today.

You can create as many as you want. Gradually implement a workflow for each area of your organisation and eventually you’ll create your entire org chart. Here’s how to get started.

If you need help be sure to reach out to our support team.

And remember envisage includes Statistics, Org Chart and OKRs and you can try for free on a no-risk 14-day trial. We’ll even help you set up all your existing statistics to make sure you succeed in getting your business onto Envisage. 

Comment and ask questions below or ask questions privately.

In Best Practice Tags Org Chart, Work Flows
Comment

Welcome to Envisage Tours - Simple Onboarding For Your Entire Team

February 14, 2020 MetaPulse Team

We’re thrilled to launch the next phase of development—Envisage Tours!

A "Tour" is a step-by-step guide that shows you how to use each major feature of envisage. These will help save you time and get the most out of our app.

Read more
In Technology Tags Tours
Comment

Still using spreadsheets to track your stats? Save time with MetaPulse.

January 30, 2020 MetaPulse Team

Clients never cease to be amazed at the amount of time they can save when taking advantage of the features in MetaPulse age. 

Here’s some common scenarios we’ve come across: (And if any of these apply to you, we can save you a lot of time.)

  1. It takes you more than 1 hour per week to work out the stats and enter them into your existing system.

  2. You add stats daily to a spreadsheet and then tally them for your weekly or monthly stats.

  3. You manually add up different stats using a calculator.

  4. Your stats are spread across several different spreadsheets.

  5. You track the stats by paper and spend hours entering them into a system.

  6. You have to constantly chase your team to report their stats to you.

If you’re suffering from any of the above, we can help streamline your stats reporting process. We’ve helped many clients save countless hours collating a myriad of numbers.

Entering statistics should be a simple and easy task. More time should be spent on analyzing and implementing solutions to improve those statistics.

Need help? Reach out via support  or just reply to this email and we’ll help you get set up. 

Remember you can try MetaPulse for free on a no-risk 14-day trial—it includes stats, org chart and objectives. We’ll even help you set up all your existing statistics to make sure you succeed in getting your business onto MetaPulse. 

Comment and ask questions below or ask questions privately.

In Best Practice Tags stats, analytics
Comment

New Features for 2020

January 29, 2020 Mikel Lindsaar
header.jpg

We’ve got a lot of new features currently in development and we thought you’d like to know what we plan to release in 2020.

  1. Events Log

  2. Email Notifications

  3. Trend Recognition

  4. Org Chart Templates

  5. Reports

  6. Data Sources

  7. Policy

Read more
In New Features
Comment

How OKRs helped Google Chrome Become the Most Popular Browser in the World

January 14, 2020 MetaPulse Team
OKRs help Chrome beomce most popular browser 2.png

In 2008 Google set an Objective to build the next generation client platform for the future of web applications, in other others, to build the best browser. The Objective to build was assigned to Sundar Pichai.

The timeline for the Objective , to build the best browser, was set at 3 years.

Pichai decided that the Key Result to track that objective was number of users and set an audacious goal of 20 million by end of 2008.

Read more
In Technology Tags OKRs
Comment

Achieve your business goals in 2020 with Objectives

January 7, 2020 MetaPulse Team

Last month we released our long awaited objectives feature.

It’s a powerful system used by tech giants such as Google, Linkedin and Intel.

For over 6 months we’ve have this feature thoroughly tested with a select few of clients and now it’s ready for you to use.

Let’s take a look at how you can use Objectives to achieve your business goals for 2020...

Read more
In Best Practice Tags OKRs
Comment

Save time - Use a cumulative statistic to automatically track a weekly statistic

December 19, 2019 MetaPulse Team
total users and weekly new users.png

With some statistics it’s easier to track the cumulative or total.

For example, in envisage we track our Total Users, which is growing every day.

Rather than work out the number of New Users manually, we do it automatically using the total. This saves extra data entry and time.  

This method takes advantage of the Offset feature.

Here’s how it works...

Read more
In Best Practice Tags calculated graphs
Comment

2019 … A year of stellar growth!

December 17, 2019 Mikel Lindsaar
envisage-banner.png
total users 2019 dec.png

It’s been an amazing year at envisage and we want to thank you for your support and patronage during 2019.

It was a year of tremendous expansion for us in many ways.

Our user base has grown 263% to almost 4,000.

More than 52,000 graphs have been created that track over 8.2 million individual statistic entries.

We added two new powerful features - the Org Chart and Objectives.

We’ve also developed Events, Trends and Reports, which will be released early next year once the beta testing is complete.

All of this combines into 694 different features, bug fixes and upgrades individually created, reviewed, approved and deployed adding up to 1,231 files changed and representing 65,890 lines of code added and 21,358 lines of code deleted.

Our Help Center has grown to 123 articles. We handled almost 700 support enquiries with 97.3% of our customers happy or extremely happy with our service.  

In March we launched our envisage blog and weekly newsletter to keep you informed of our activities and over 1,500 of you have visited our blog and viewed almost 3,000 pages.

What does all of this mean?

It means 2020 is going to be even better! And remember, if you haven’t already signed up for your envisage subscription, we’ve got new pricing starting in January, so lock in the current rates now. 

From myself and all the team at envisage, we wish you a Merry Christmas and a prosperous New Year!

Mikel Lindsaar, CEO & Founder

panels-02.png

Try envisage for free on a no-risk 14-day trial. We’ll even help you set up all your existing statistics to make sure you succeed in getting your business onto Envisage. 

Comment and ask questions below or ask questions privately.

In Technology Tags Stats, OKRs, analytics, Org Chart
Comment

Objectives Released and New Pricing Coming 2020

December 11, 2019 Mikel Lindsaar
new feature new pricing 2020.png

We’re excited to let you know that we have released our new Objectives and Key Results feature!

In development for 12 months and thoroughly tested by our largest clients, this provides you with a way to set and meet real objectives in your organisation, all backed by actual statistics.

We are pretty excited about this!

We’re also adopting a new pricing model starting 2020. It will only apply to new clients, so this month is your last chance to lock in the current rates. 

For our current clients … as a reward for your loyalty and support during our fledgling years, we’re going to keep you on the current pricing—your part of our legacy, so the Legacy Pricing applies to you. (You’re welcome😉) 

Read more
In New Features
Comment

Org Chart design made even easier with these two new features

November 26, 2019 MetaPulse Team
floating org nodes.png

Org Charts come in all shapes and sizes. 

And to make it easier to design your ideal Org Chart, we’ve added two highly requested features.

  1. Floating Org Nodes

  2. Easily Rearrange Child Nodes  

Let me show you how they work…

Read more
In New Features, Technology Tags Org Chart
Comment

A Business Opportunity — Worldwide Franchise Language Rights

November 22, 2019 MetaPulse Team

We’ve had the goal from the very beginning, to bring usable business management tools to every corner of the Earth, which is why we built envisage with full multilingual support from the ground up.

This allows us to make it available in any language.

This also provides a business opportunity for those who are interested — the worldwide franchise rights for a language. 

Here’s how it works...

Read more
In Technology Tags Business Opportunity, translations
Comment
← Newer Posts Older Posts →
TRY envisage for 30 days
ASK US ANYTHING
 
MetaPulse RSS

chat with support.png
search the help center.png
schedule a free demo.png

Topics

Case studies
Best Practice
Business Coaching
Technology


Get free tips and insights once a week

We respect your privacy.

Thank you for joining and welcome to the team!


240px-Cc.logo.circle.svg.png
Cc-by_new.svg.png
 

© 2019 exec.io
except where otherwise noted content on this site is licensed under a Creative Commons Attribution-ShareAlike 4.0 International License.

PRIVACY POLICY | TERMS & conditions | COMMISSION DISCLOSURE